Points clouds rendering
X-PAD Office Fusion is equipped with several commands to manage the display of scan data:
Change the size of the single point.
Set different ways of coloring the cloud.
Enable/disable the visualization of the different components of a point cloud.
Point size and point density
The function Point size and Point density allow to define the pixel size and the point density used to display the points cloud.
Click Cloud.
Click Point Size.

The drop-down menu allows to define the point size and the point density.
The Point size defines the pixel size to display the point cloud.
Small: point size is small. | 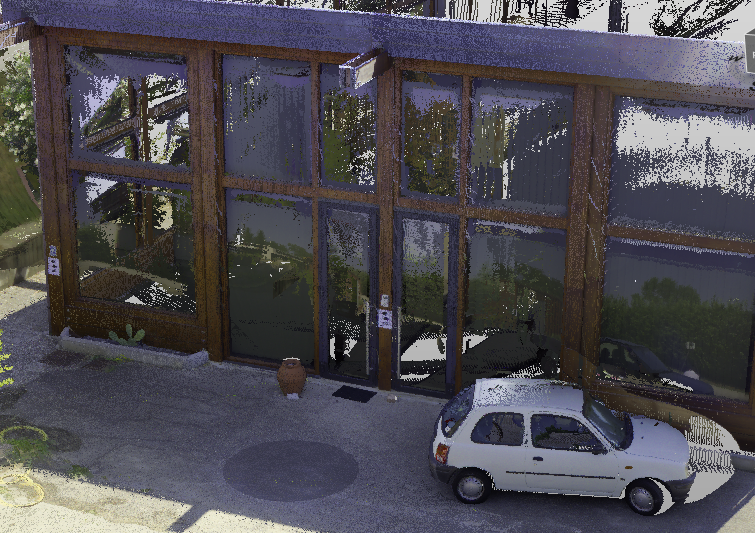 |
Normal: point size is normal (default selection). | 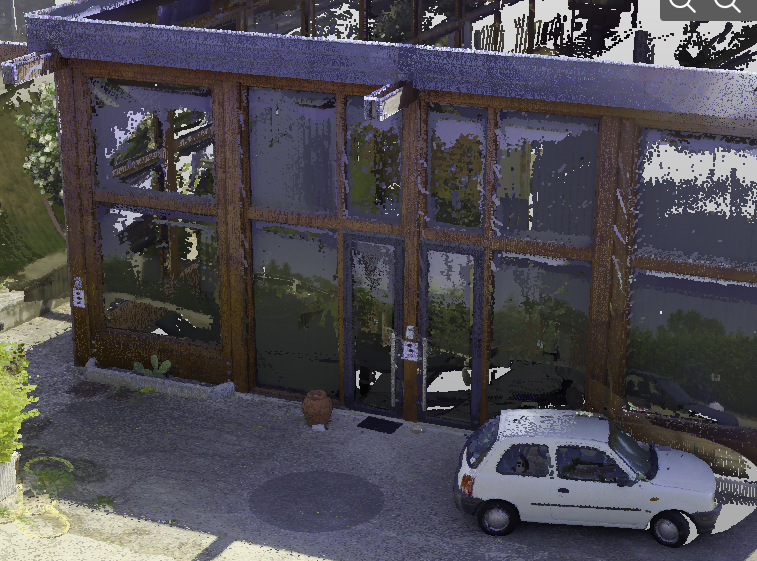 |
Large: point size is large. | 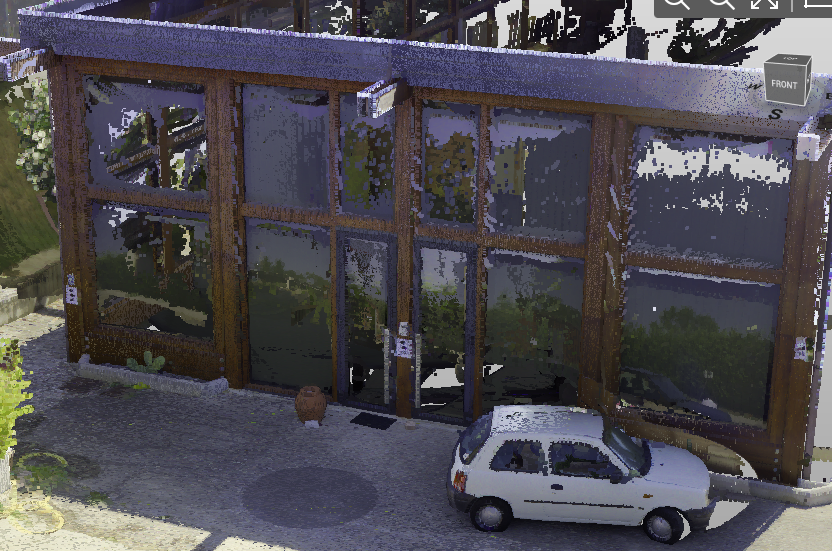 |
Extra large: point size is extra large. | 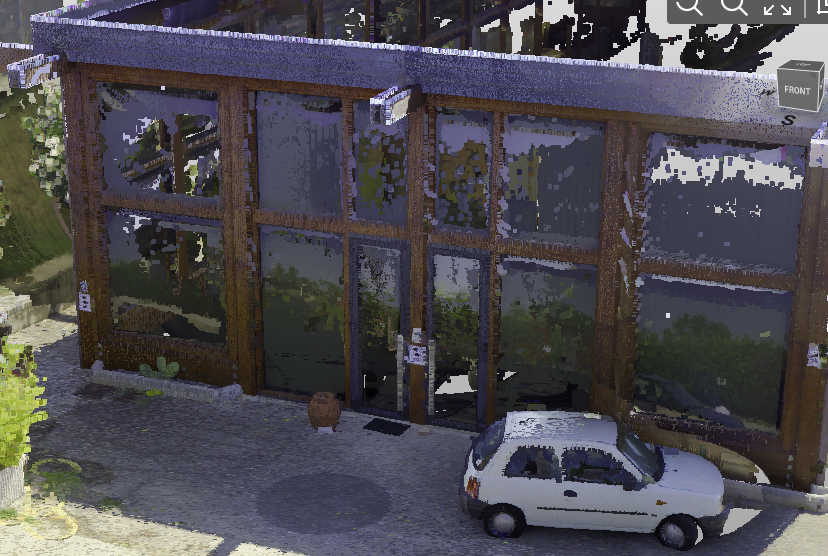 |
The points density allows to select the visualizations of points for each pixel.
Automatic: displays maximum number of points. (default selection) | |
Level 1: screen density of one every pixel. | 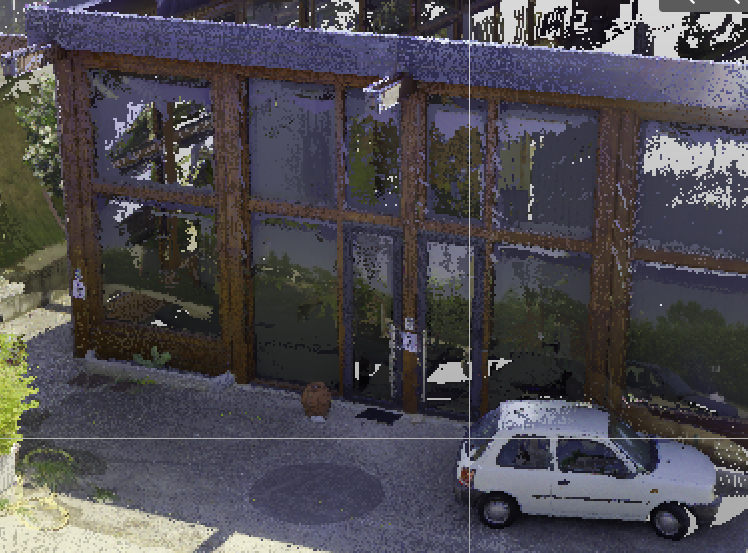 |
Level 2: screen density of one every two pixel. | 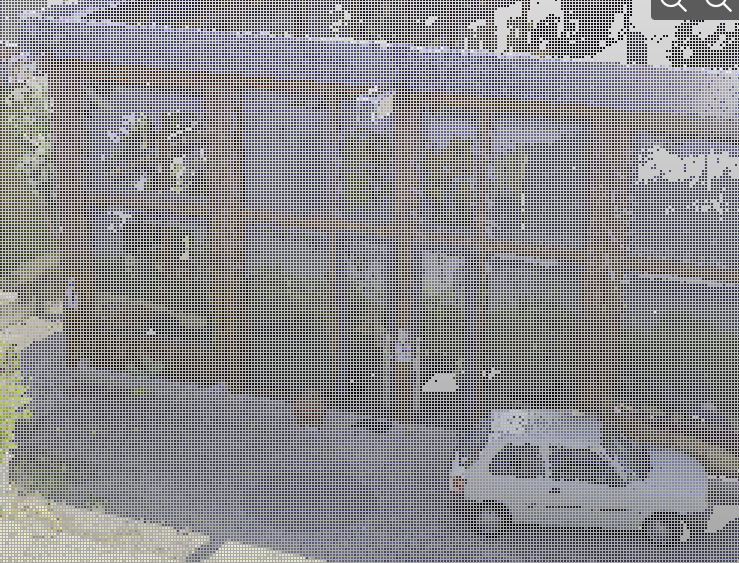 |
Level 3: screen density of one every three pixel. | 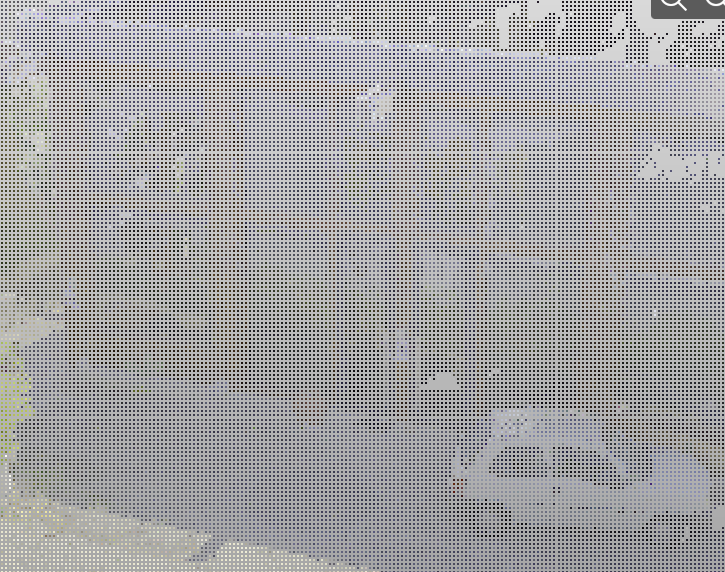 |
Level 4: screen density of one every four pixel. | 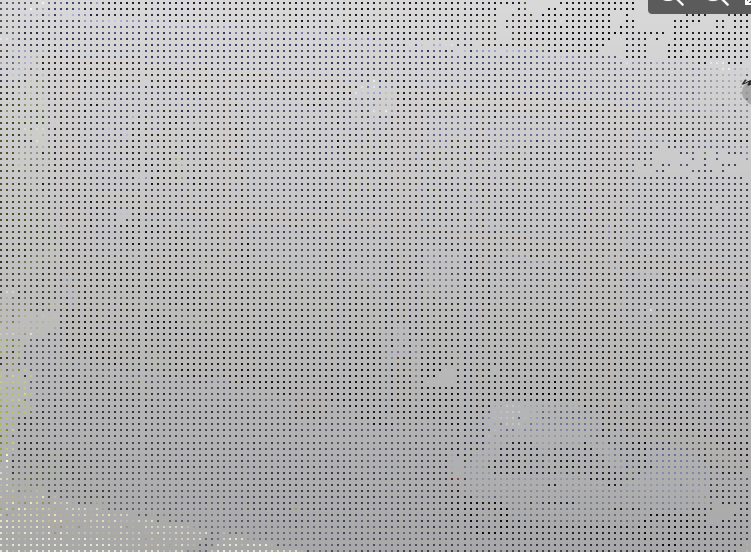 |
Rendering mode
This command allows to define the rendering mode to display the point cloud.
Click Cloud.
Click Rendering mode.

The drop-down menu allows to define the rendering mode.
Color: applies to scans the main color set. | 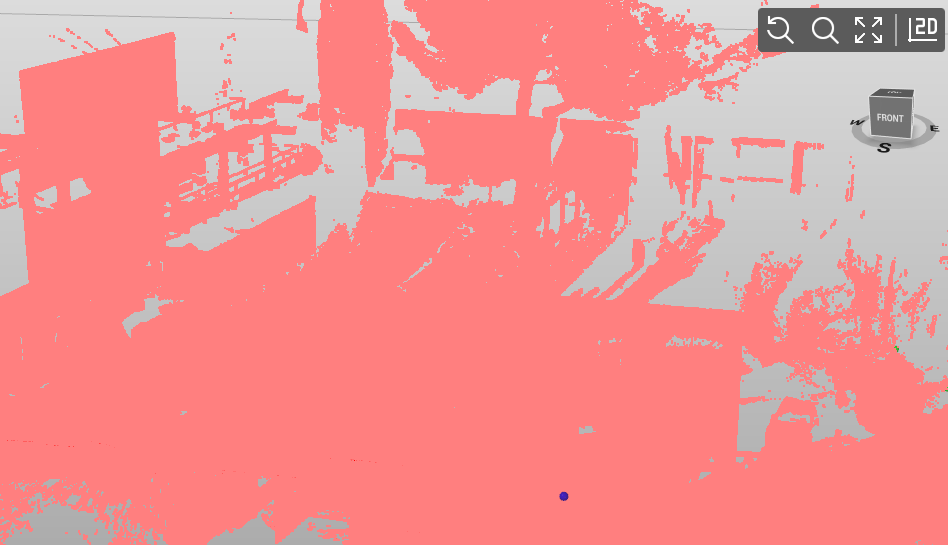 |
Intensity: colors all scans with a grayscale based on the intensity of the reflectance. | 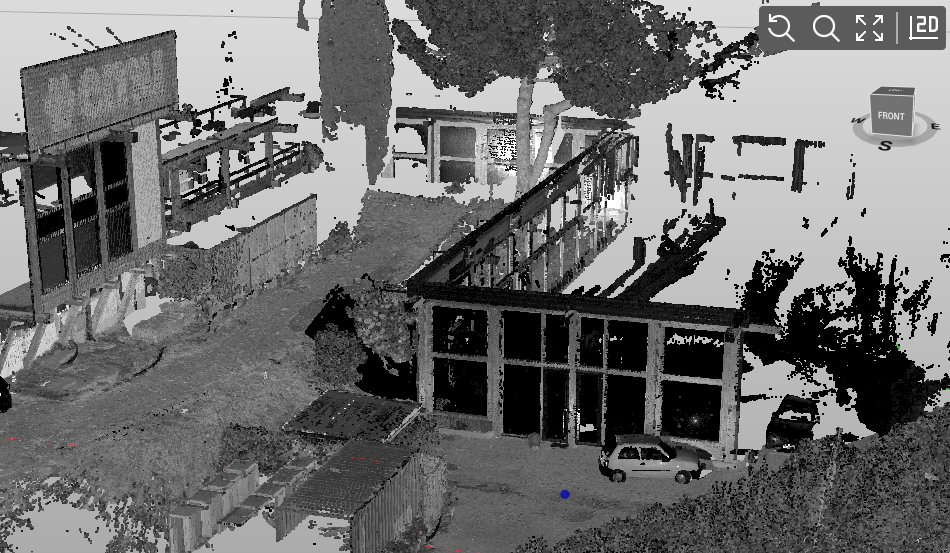 |
Intensity coloured: colors all scans with a color scale depending on the intensity of the reflectance. The color assigned to the point clouds by the program is used. | 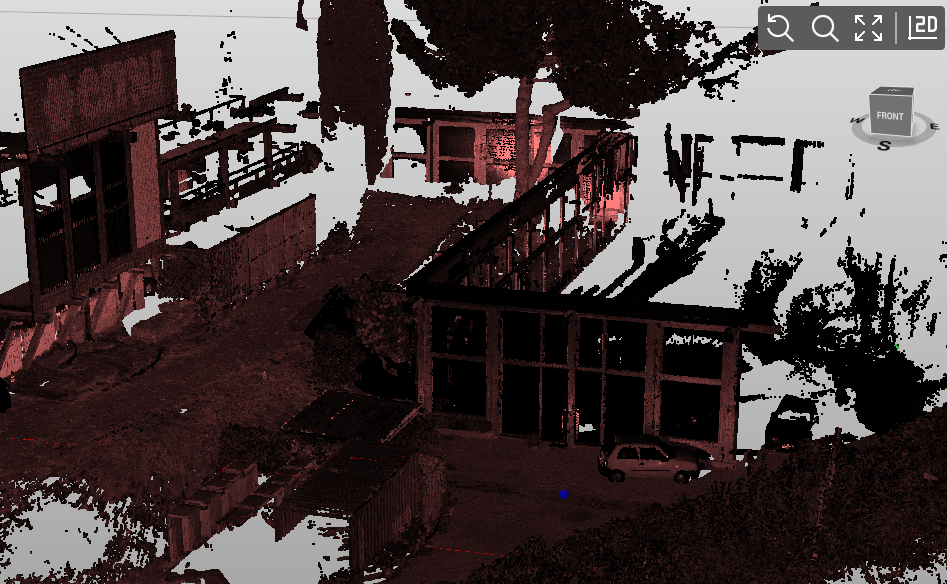 |
By elevation: colors all scans with a color gradation based on the elevation. A fixed color scale ranging from red (high) to blue (low) is used. | 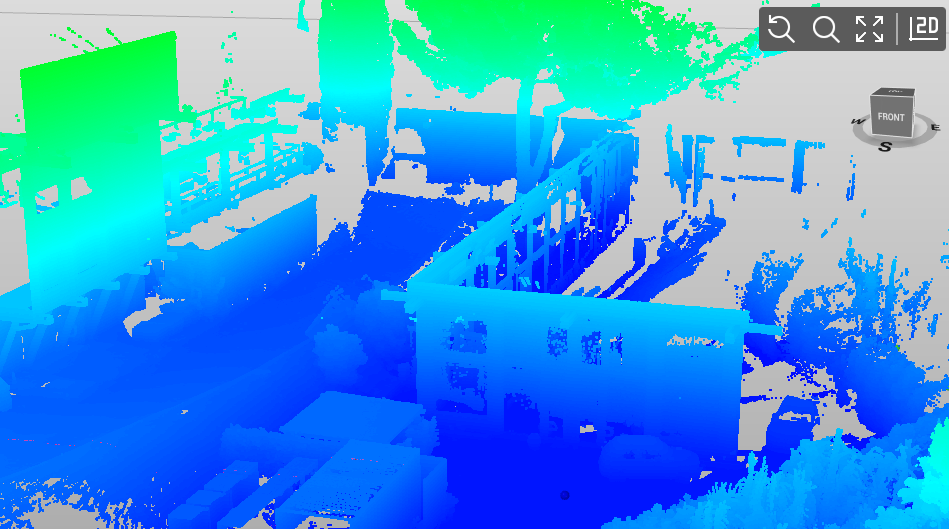 |
By distance: colors all scans with a color gradation based on the distance from point cloud center. A fixed color | 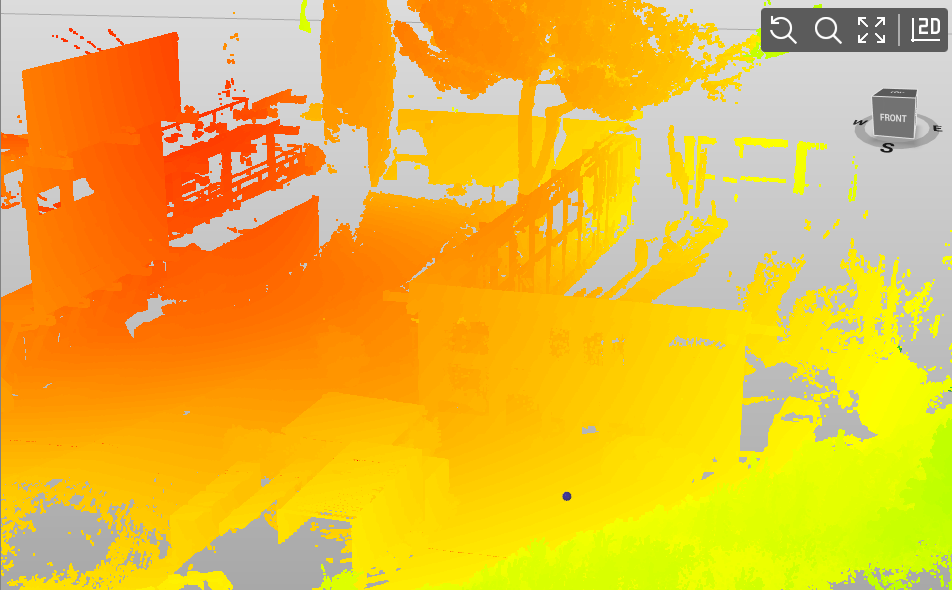 |
View/hide point clouds components
It is possible to enable/disable the visualization of different points clouds components.
Points
 : shows/hides points from the points clouds.
Setups
 : shows/hides the setup symbols.
Pano images
 : shows/hides panoramic images when Panorama visualization mode is enabled.
Center marker
 : shows/hides marker in the center of points clouds. The marker can be used to select the points clouds in editing commands.
Bounding box
 : shows/hides the points clouds bounding box. The box can be used to select the points clouds in editing commands.