
-
Use the command Polyline to create a drawing table with coordinate, distances and directions of selected polyline.
-
Click Draw.
-
Click Polyline.

-
The command opens a panel on the right.
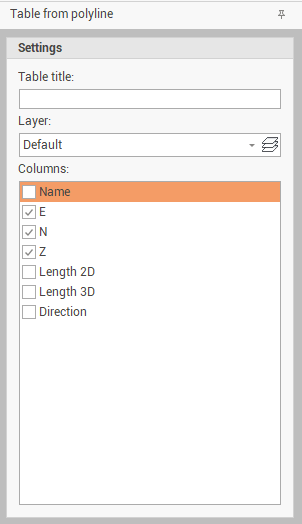
Enter the requested information and press Add to add the table to the drawing.
-
Table title: the title of the table
-
Layer: to select on which layer create the table.
-
Columns: to select which information display on the table.
-
-
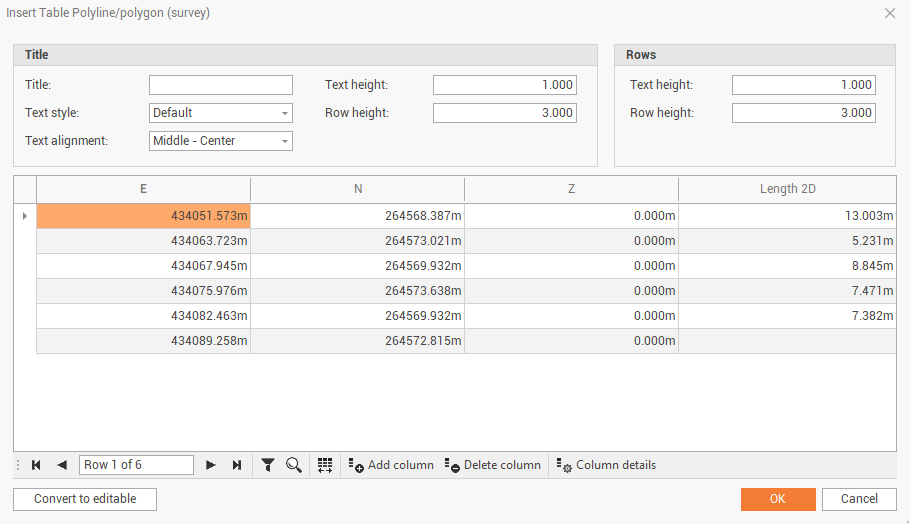
Select graphically the polyline on the screen. This open the following window.
-
The panel shows the table information. Here we can edit the content of the table and the design.
-
Title: the title of the table.
-
Text style: select from the available text styles the text style to use.
-
Text alignment: the alignment of the title text.
-
Text height: the height of the title text.
-
Row height: the height of the title row.
-
-
Rows: parameters on table rows.
-
Text height: the height of the text in the rows.
-
Row height: the height of the table rows.
-
-
In the bottom part of the table there are some commands to edit the table.

-
Filter: adds the possibility to filter the values in the columns.
-
Find: opens the search panel.
-
Auto width: enable it to automatically adapt the width of the columns to the content.
-
Add column: this function opens a new window to give the possibility to add additional columns.
-
Delete column: deletes the selected column.
-
Column details: this function opens a new windows to edit the column properties.
-
Convert to editable: allows to edit the table content.
-
-
Click OK and on the graphic view click to insert the table on the desired position.
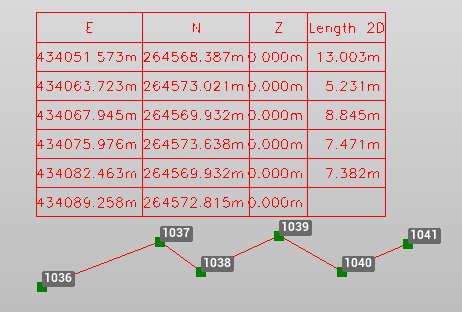
Table contents are dynamic. If the entities change their properties, the table automatically updates the information