Auto Measuring report
 + AUTOMEASURING
In the report page it is possible:
To see the result of the sessions.
Export manually the result.
Create a new customized export template.
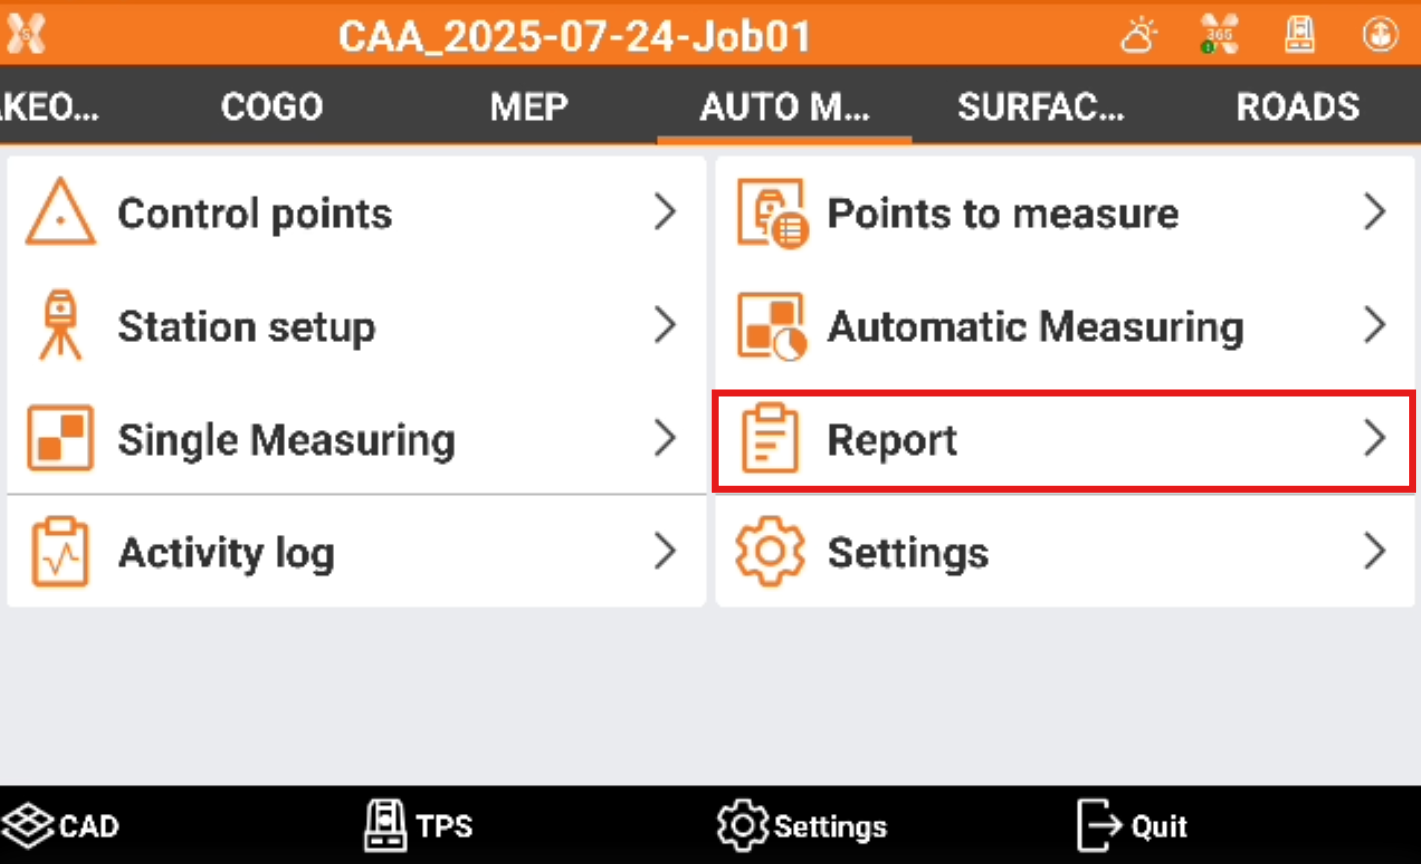
To open the page click Report.
Analyze the result
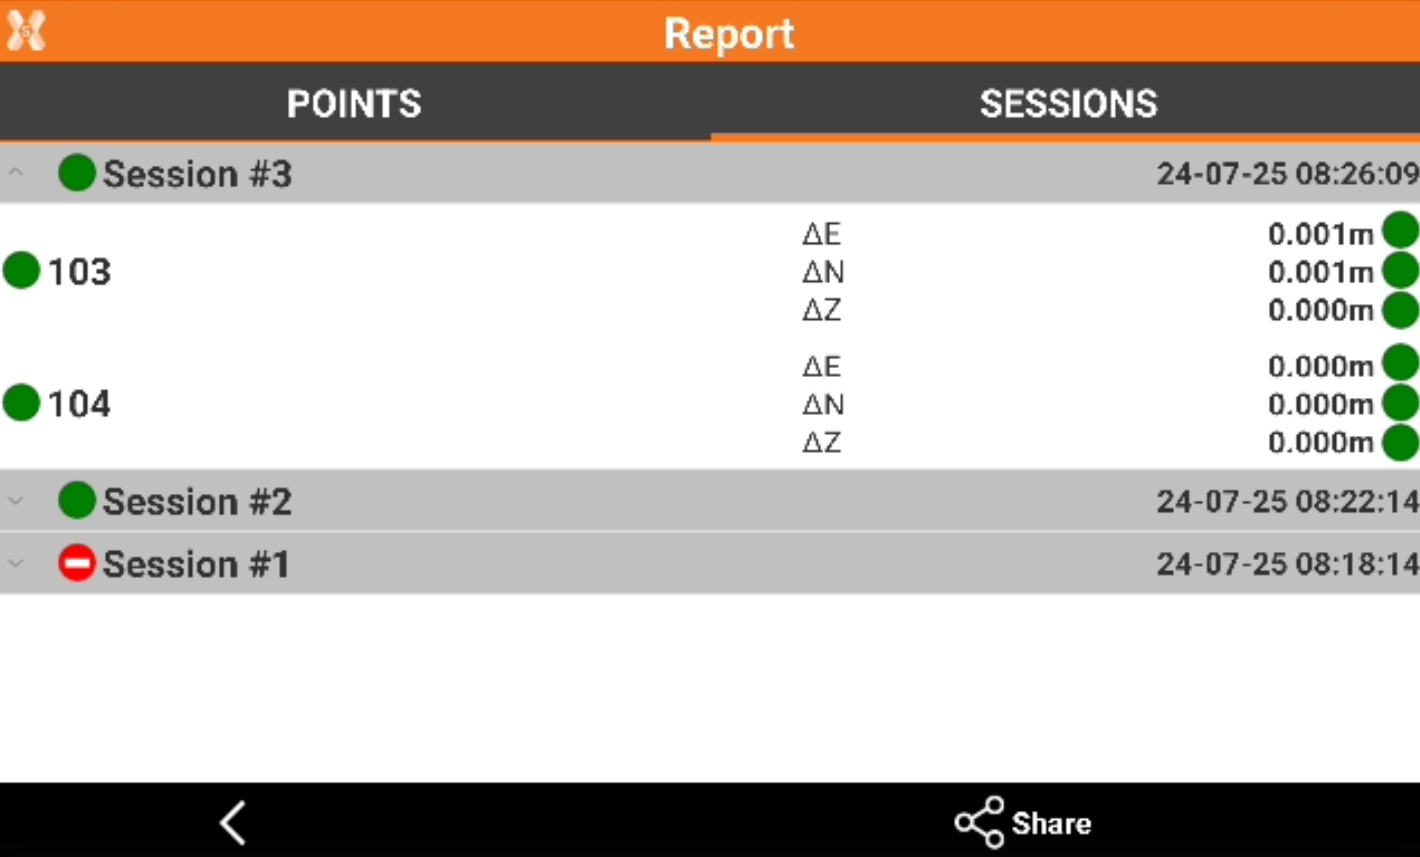
The results are available in the Points tab and Sessions tab.
Points tab: results are organized by point name.
Sessions tab: results are organized by session number.
For each point the difference from the calculated coordinate and the reference coordinate is calculated.
 : the value is within the tolerance.
 : the value is outside the tolerance.
Export the result
To export the result click Share.
Select the format to export.
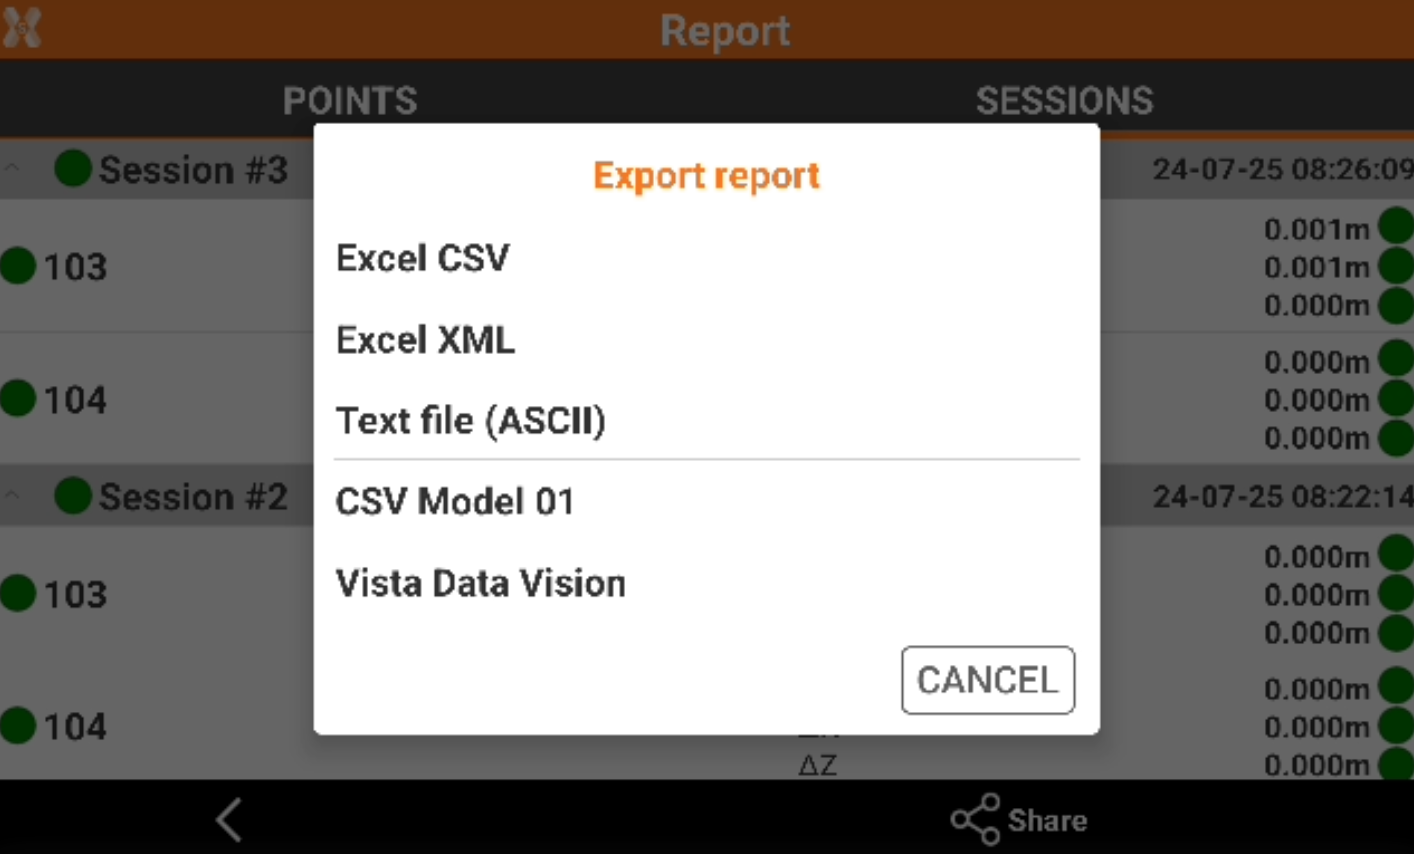
Excel CSV: data is exported in a CSV file that can be opened with a text editor or Excel.
Excel XML: data is exported in a XML file compatible with Excel.
Text file (ASCII): data is exported in ASCII, it is possible to customize the information to export. For more information on how customize an ASCII please refer to Export ASCII.
Vista Data Vision: data is exported in a text format compatible with the office software Vista Data Vision.
For more information on the export procedure please refer to Export and share .
Create an export format
From the Report page it is also possible to define a new format, that can be used to generate the automatic report at the end of each monitoring cycle.
Click Share.
Select Text file (ASCII).
The Export ASCII page is opened.
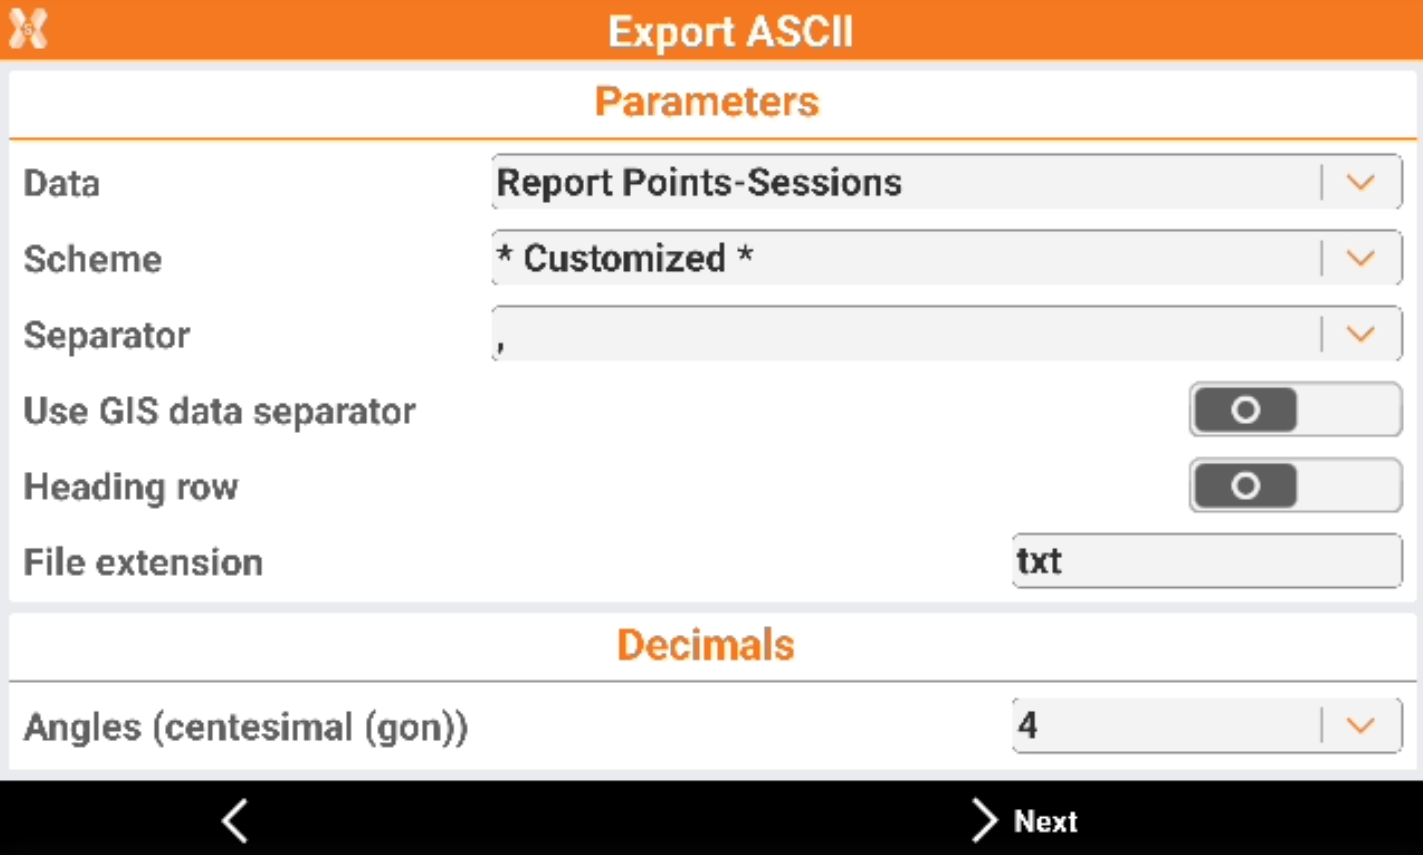
Data: how the report data is organized and what data is included.
Report Points-Sessions: the information in the report are divided by the point name.
Report Sessions-Points: the information in the report are divided by the session number.
TPS Measurements: the report lists all the raw TPS measurements with angles, distances, etc. This includes the measurements to the control points.
Report all Points-Sessions: export all sessions with information in the report are divided by the point name.
Scheme: allows to select a saved customized scheme or create a new scheme selecting Customized.
Separator: the separator to be used between the export fields.
Use GIS data separator: not used.
Heading row: enables the use of an heading row in the file.
File extension: the file extension to be used.
Decimals: allows to define the number of decimals for the numeric values.
Latitude/Longitude/Elevation: not used.
Click Next.
Define the fields to export.
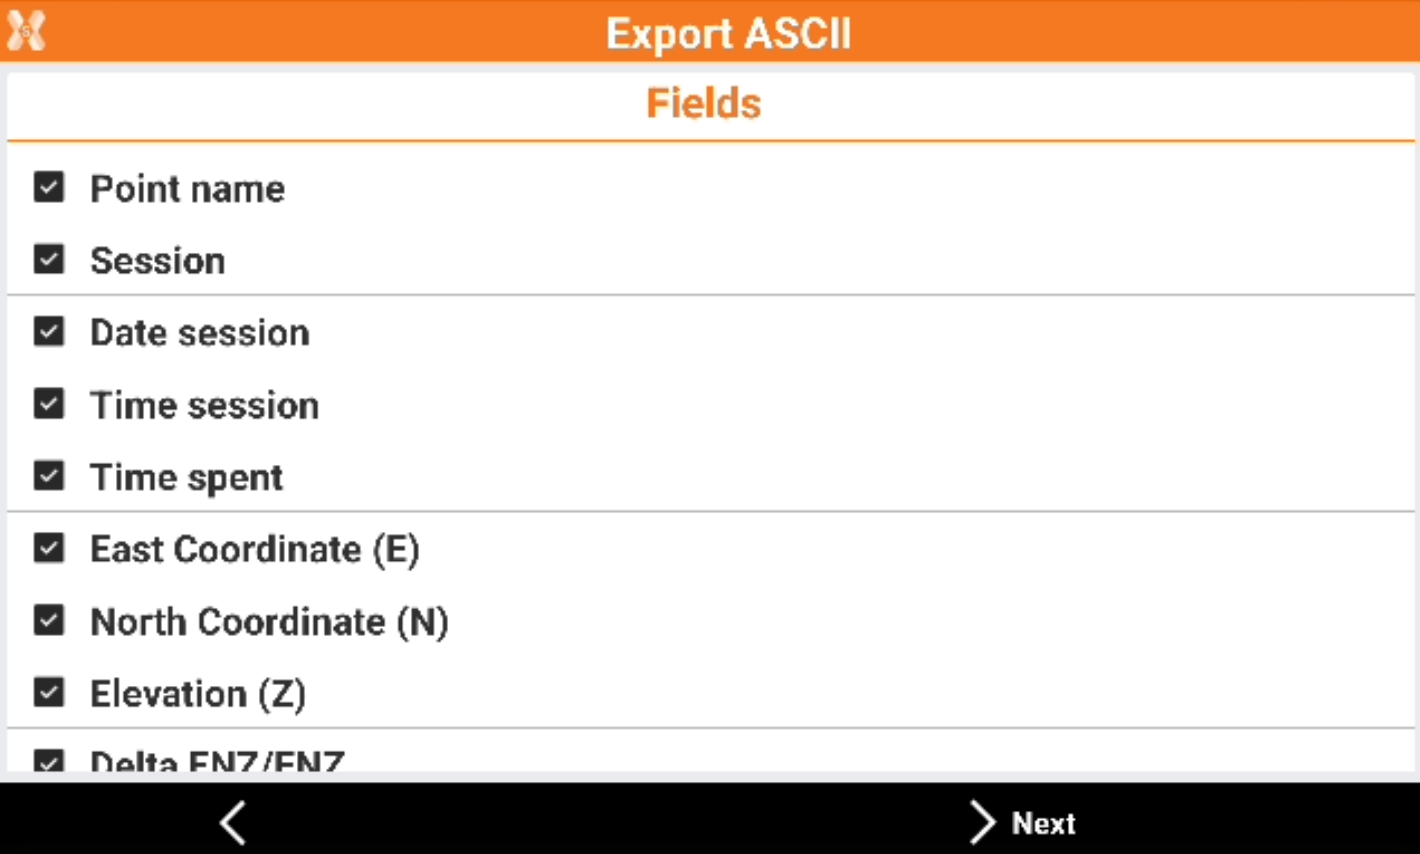
Click to enable/disable a field.
 : the field will be exported.
 : the field will not be exported.
Select a field and click Down or Up to change the export order.
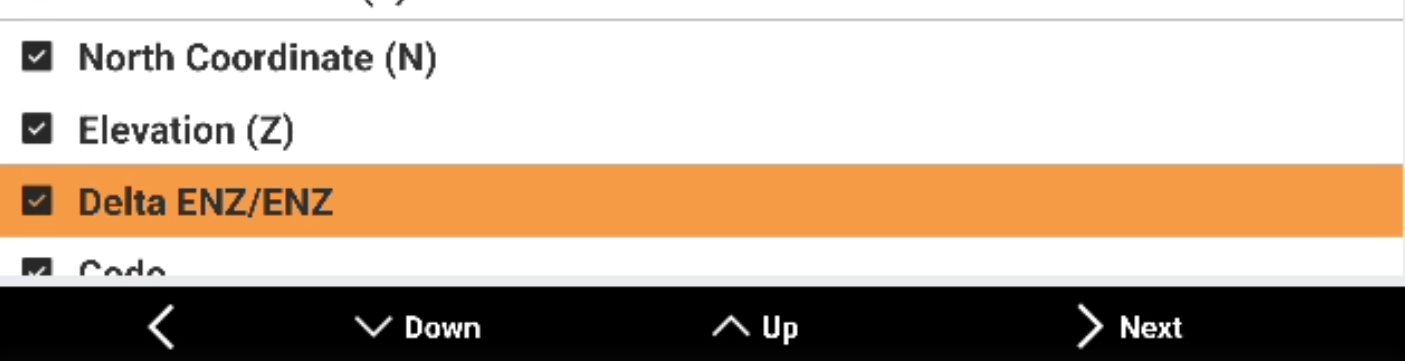
Click Next to have a preview of the export.
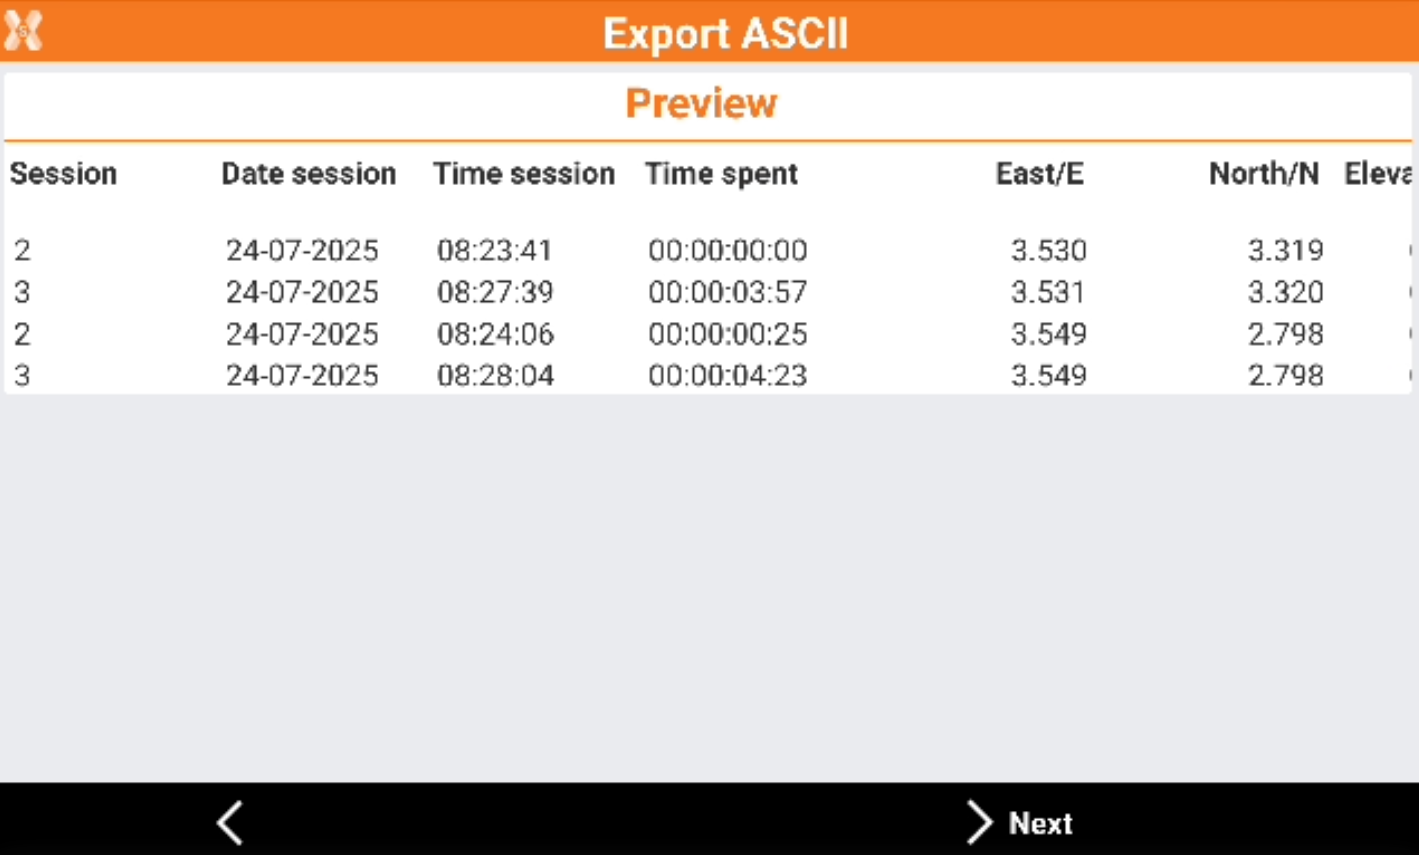
Click Next.
If the created export scheme want to be used in the data report save the scheme with a name.
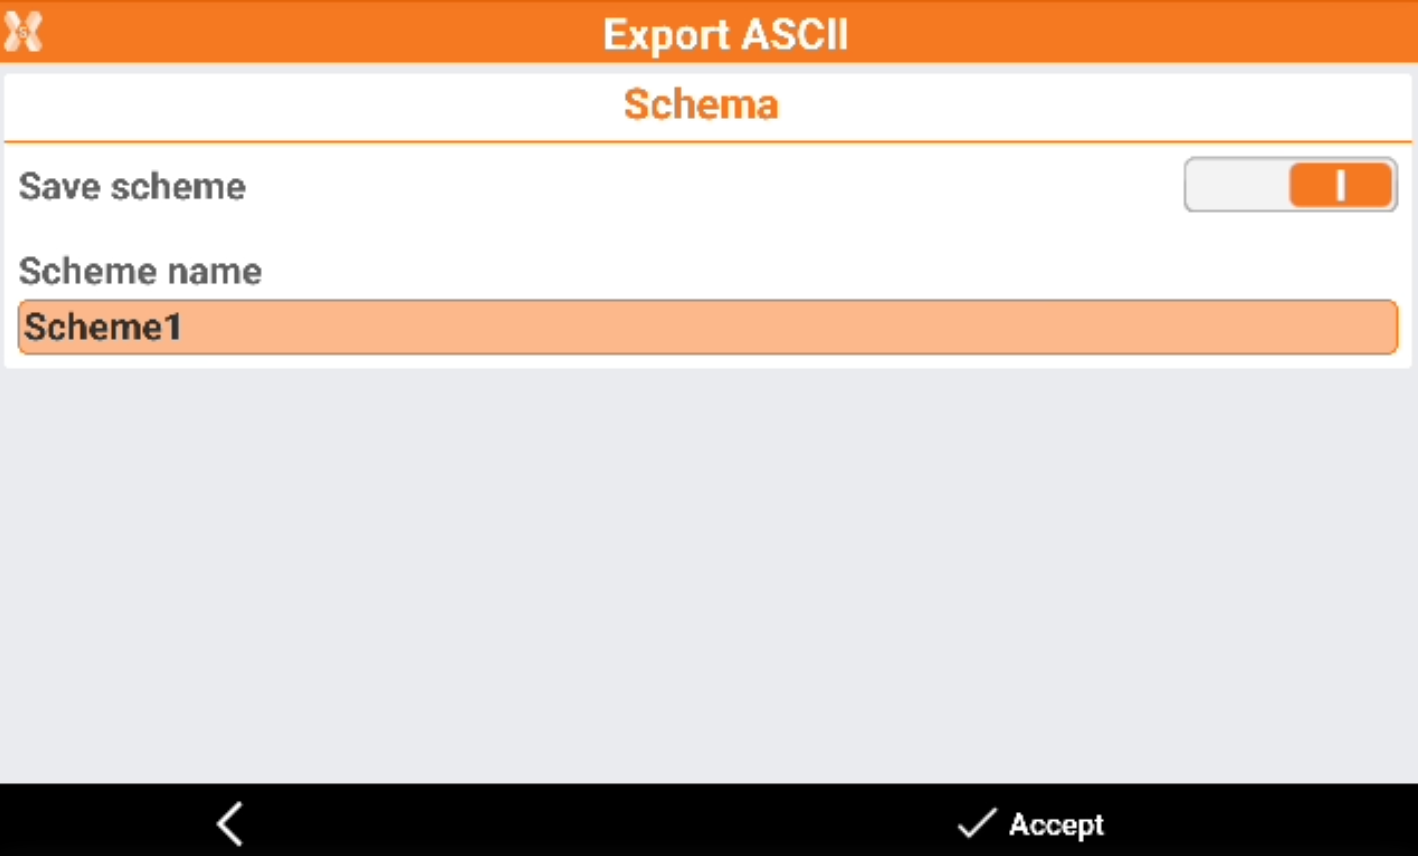
Click Accept to save the file.
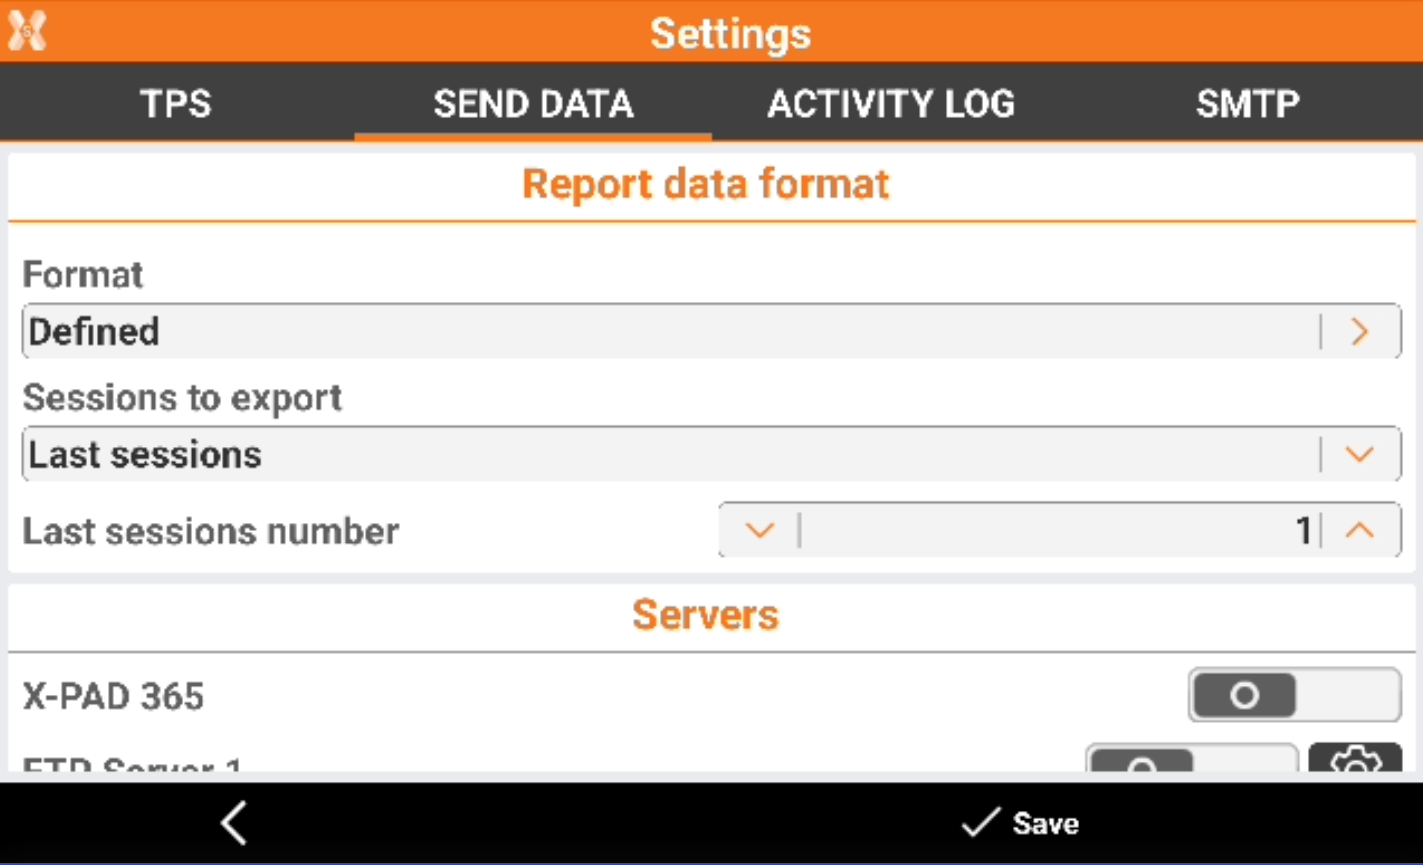
The Scheme can now be selected in Settings → Send data → Format.