Advanced Average and Analysis

The function Advanced Average and Analysis allows to measure a point repeatedly re initializing the fix calculation at each measurement session.
It is possible to customize how the sessions are performed and the error tolerance.
At the end of the measurements the software shows the residuals and accuracy information.
It is possible to export the detail of all measurements done.
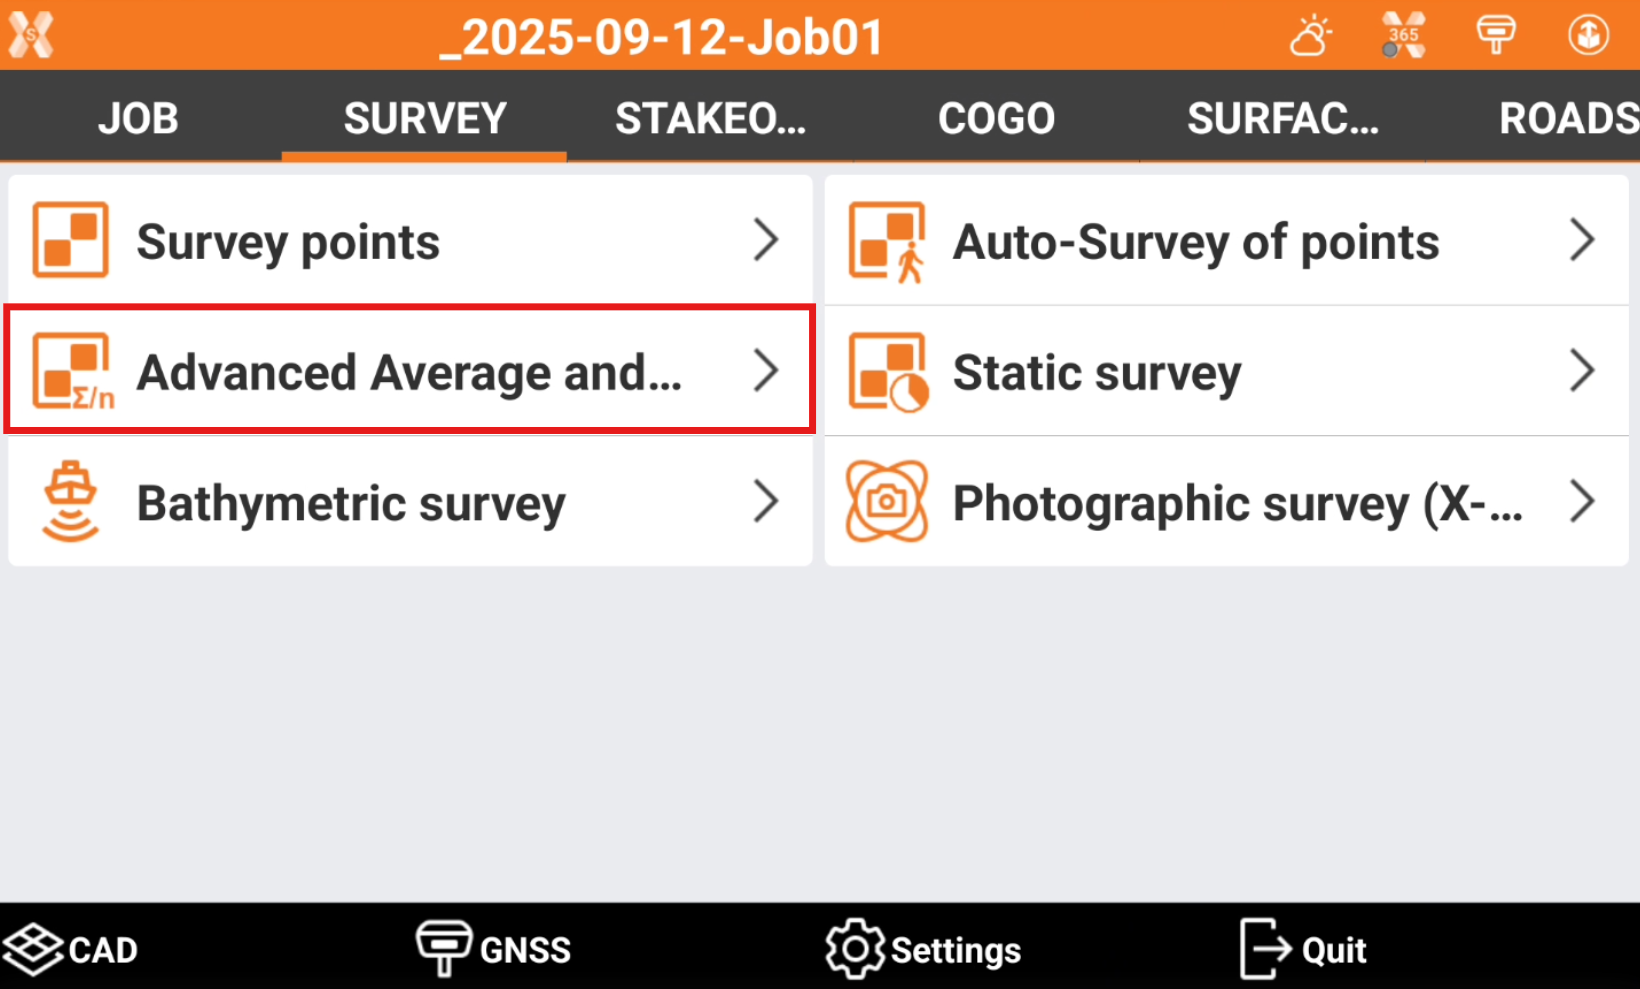
To start the application open Survey page.
Click Advanced Average and Analysis.
Enter the session parameters.
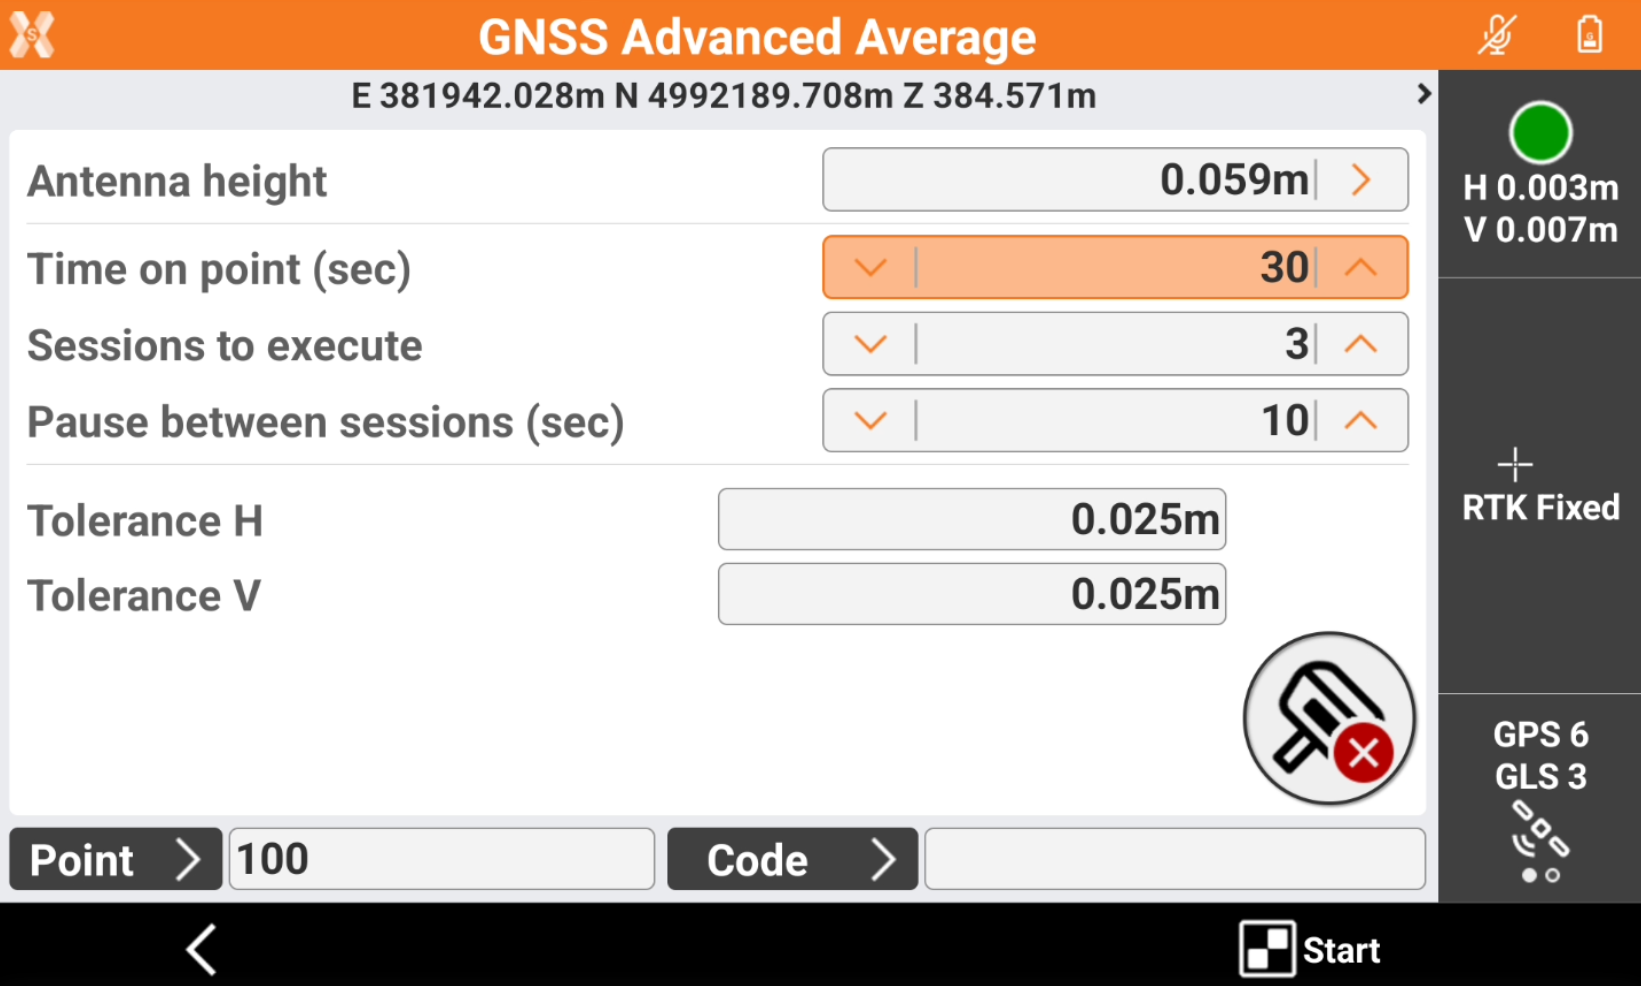
Antenna height: the height of the GNSS antenna.
Time on point (sec): defines the occupation time in seconds of each session.
Sessions to execute: defines how many sessions to execute. At the end of each session the receiver re inizialise the fix status.
Pause between sessions (sec): defines the pause time in seconds after a session is executed and while the receiver is in autonomous status without receiving RTK corrections.
Tolerance H: the value of the horizontal tolerance.
Tolerance V: the value of the vertical tolerance.
Point: the point name.
Code: the survey code.
Click Start to start the session.
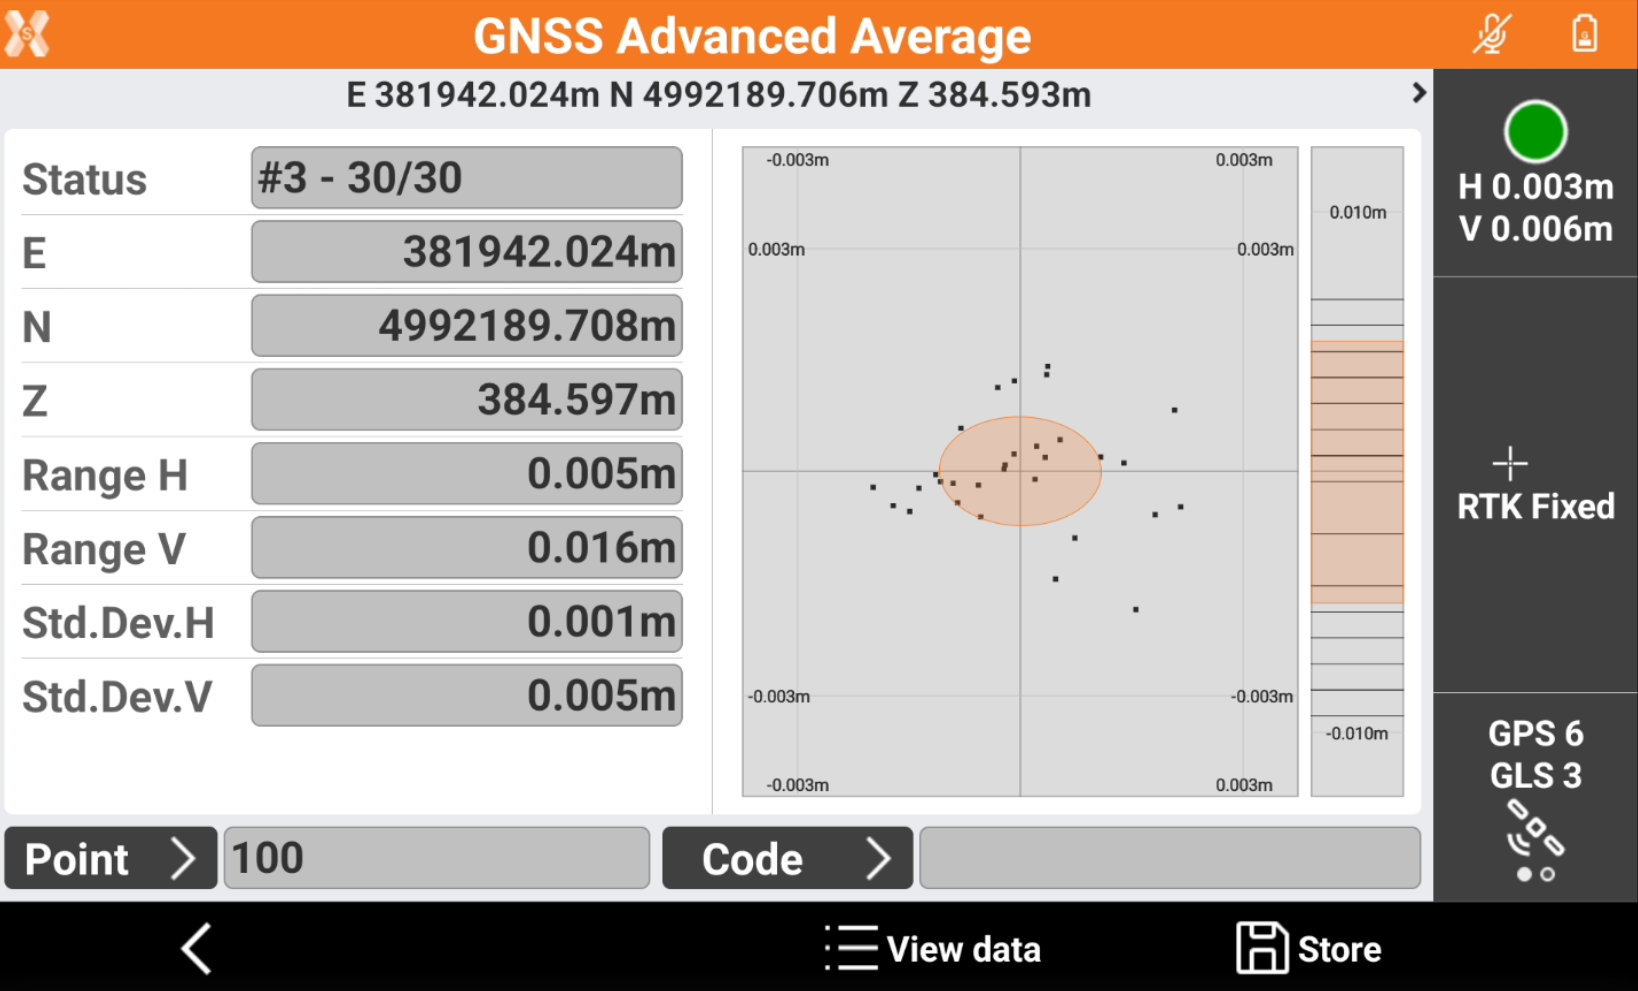
The point is measured by the time defined in Time on point (sec) and some information are visualized in real time.
Status: shows the number of measure in the current session.
E/N/Z: the measured coordinate.
Range H: the maximum 2D distance between the measured points in the current session.
Range V: the maximum elevation distance between the measured points in the current session.
Std.Dev.H: the horizontal standard deviation for the measured points in the current session.
Std.Dev.V: the vertical standard deviation for the measured points in the current session.
CI H 95%: horizontal 95% confidence level. The value represents a range within which 95% of the measured positions are expected to fall. A larger value indicates lower position quality, while a smaller value means that most points have similar positions.
CI V 95%: vertical 95% confidence level. The value represents a range within which 95% of the measured positions are expected to fall. A larger value indicates lower position quality, while a smaller value means that most points have similar elevation.
On the right panel the software visualizes the scatter plot of measured points in 2D and the points elevation in a vertical bar.
Click Pause to pause the measurements.
Click Stop to stop all measurements and close the function.
At the end of the last session it is possible to view the data and store the result.
Click View data to visualize the result of the sessions.
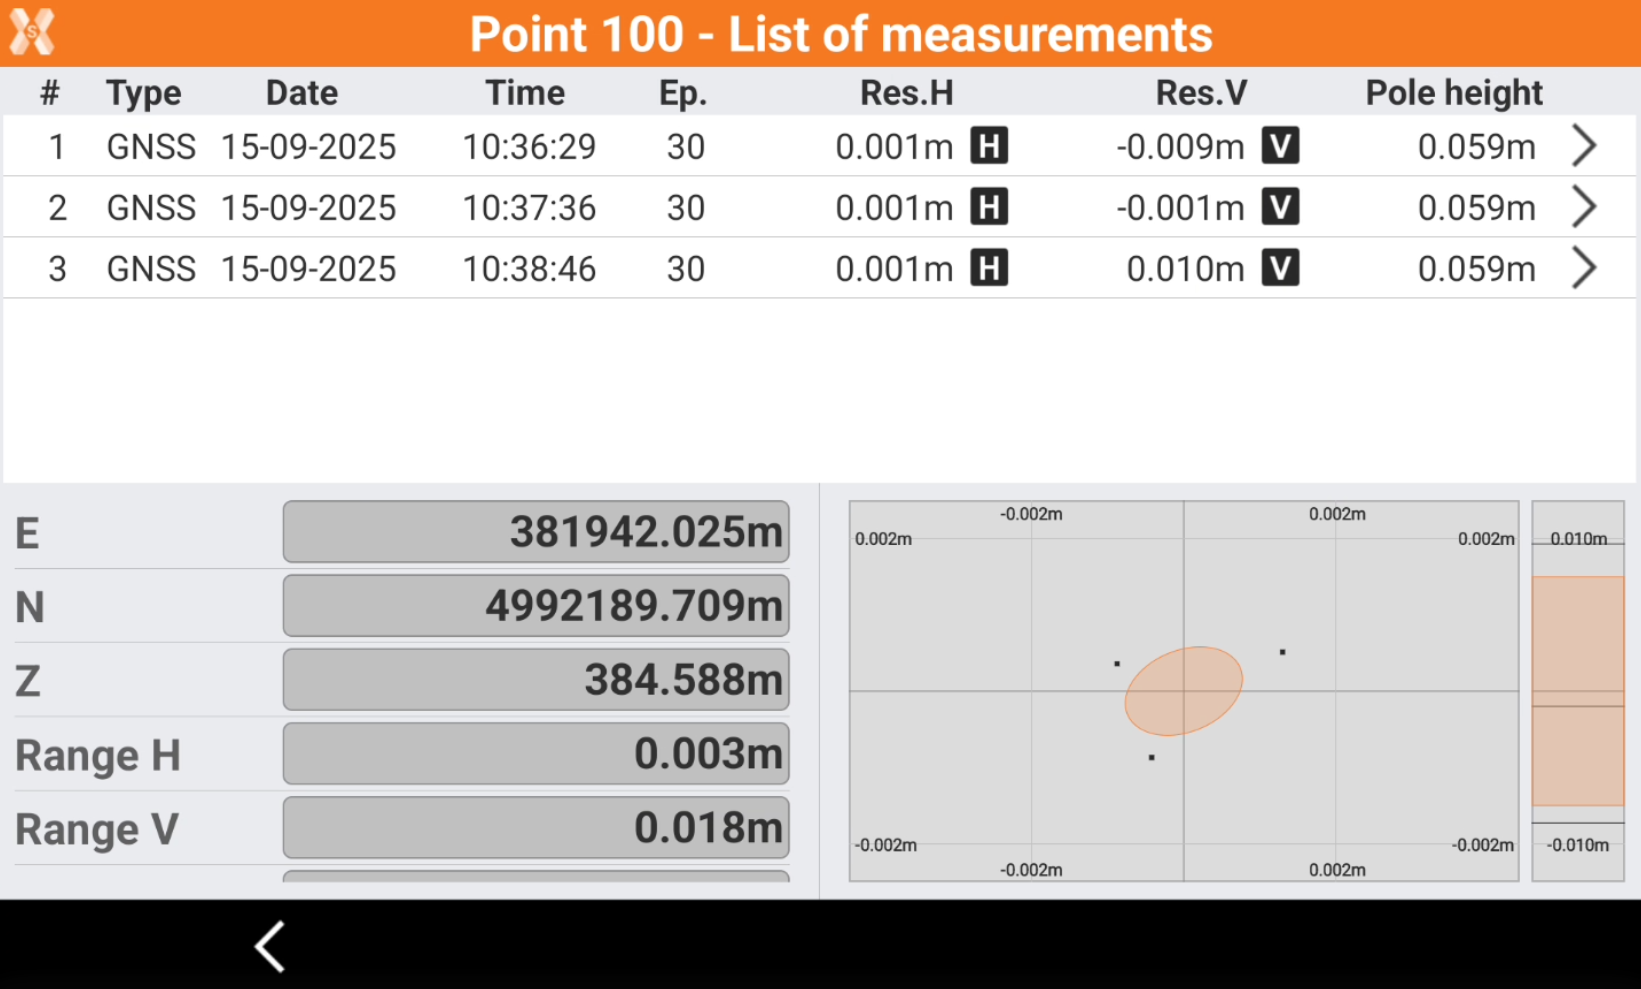
The top part of the window shows the sessions performed. Click
 or
or  to disable the use of the measurements of the session in the calculation of the final coordinate regarding the 2D or the vertical component.
The bottom part of the window lists the final coordinate and the quality result.
E/N/Z: the final coordinate of the point.
Range H: the maximum 2D distance between the measured points.
Range V: the maximum elevation distance between the measured points.
Std.Dev.H: the horizontal standard deviation for the measured points
Std.Dev.V: the vertical standard deviation for the measured points.
CI H 95%: horizontal 95% confidence level. The value represents a range within which 95% of the measured positions are expected to fall. A larger value indicates lower position quality, while a smaller value means that most points have similar positions.
CI V 95%: vertical 95% confidence level. The value represents a range within which 95% of the measured positions are expected to fall. A larger value indicates lower position quality, while a smaller value means that most points have similar elevation.
On the right-bottom part of the window the software visualizes the scatter plot of measured points in 2D and the points elevation in a vertical bar.
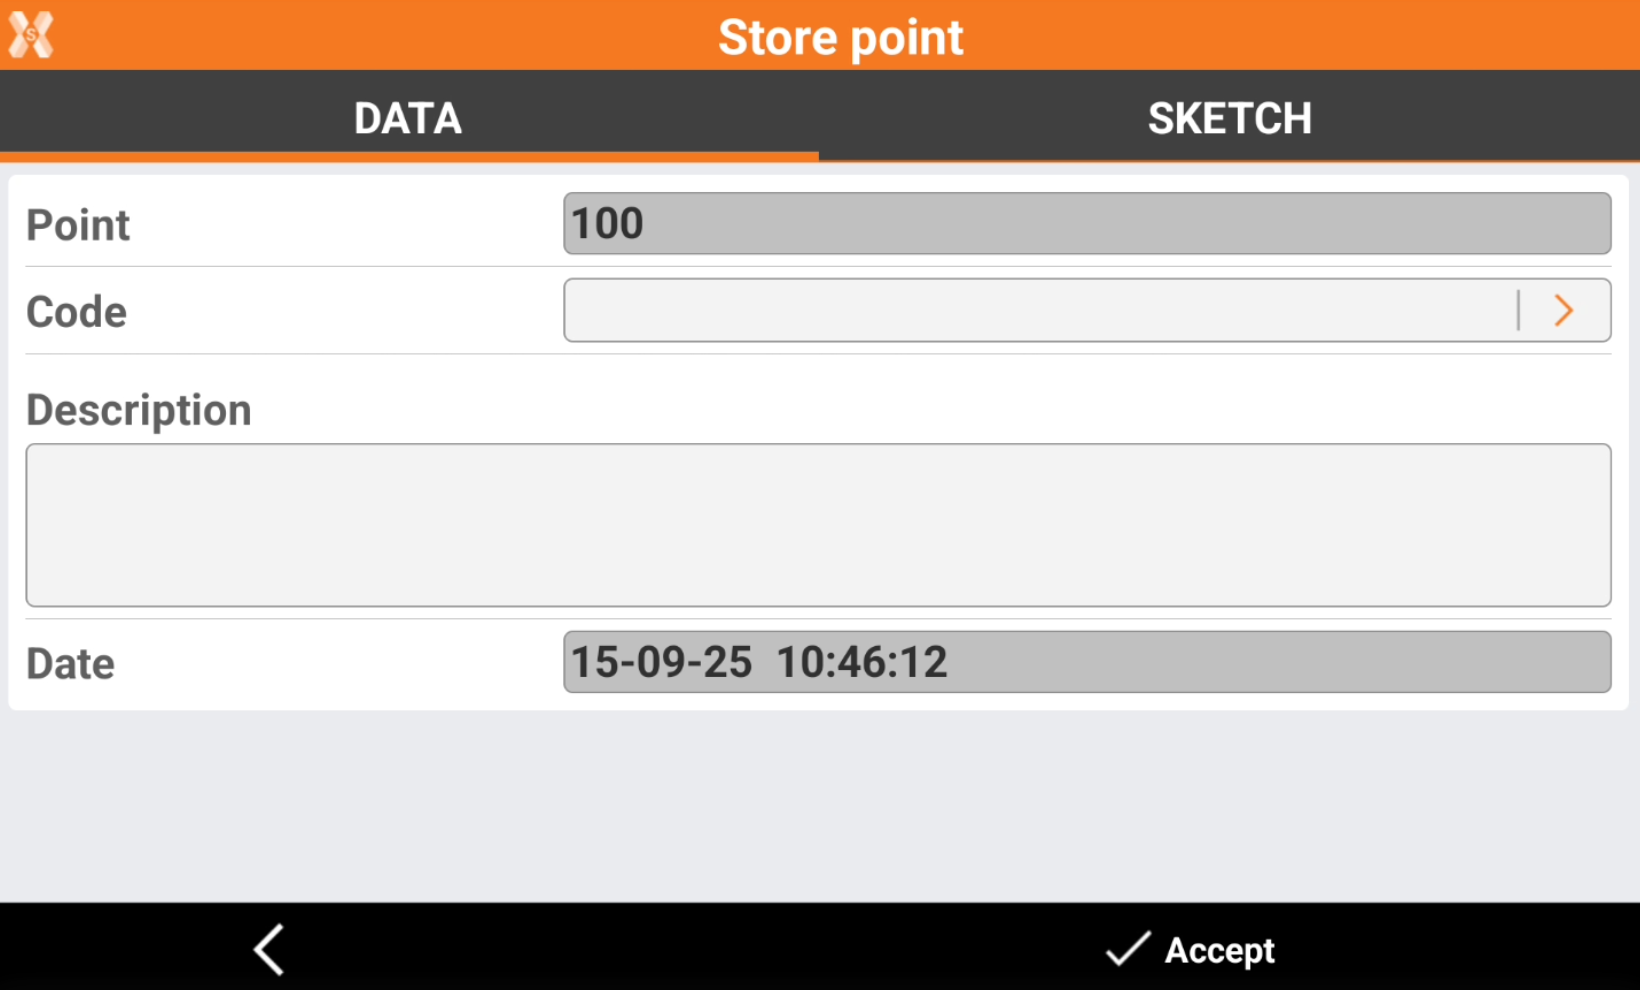
Click Store to record the measured point.
The single measurements performed can be exported as ASCII file.