X-PAD Office Fusion is equipped with several commands to manage the display of scan data:
-
Change the size of the single point.
-
Set different ways of coloring the cloud.
-
Enable/disable the visualization of the different components of a point cloud.
Point size and point density
The function Point size and Point density allow to define the pixel size and the point density used to display the points cloud.
-
Click Cloud.
-
Click Point Size.

-
The drop-down menu allows to define the point size and the point density.
-
The Point size defines the pixel size to display the point cloud.
|
Small: point size is small. |
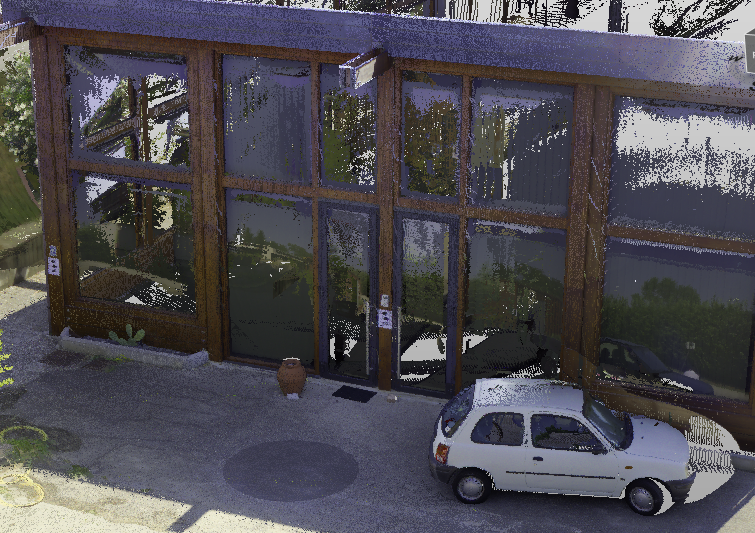
|
|
Normal: point size is normal (default selection). |
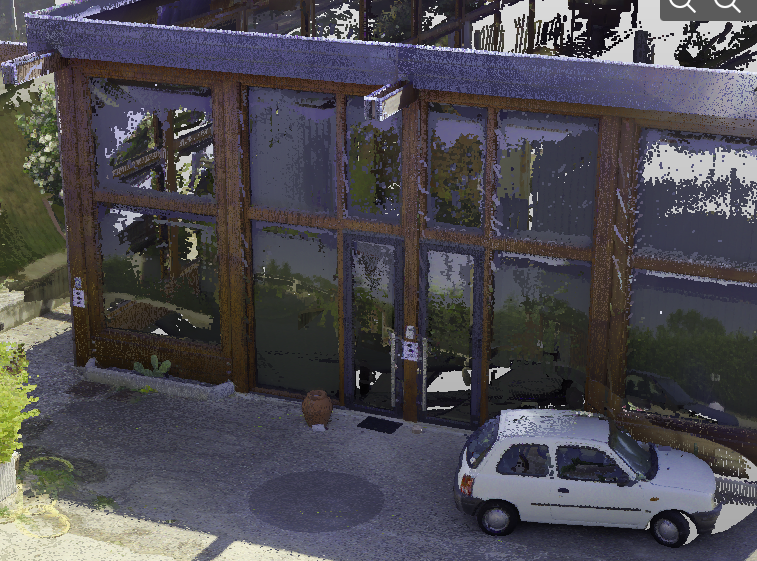
|
|
Large: point size is large. |
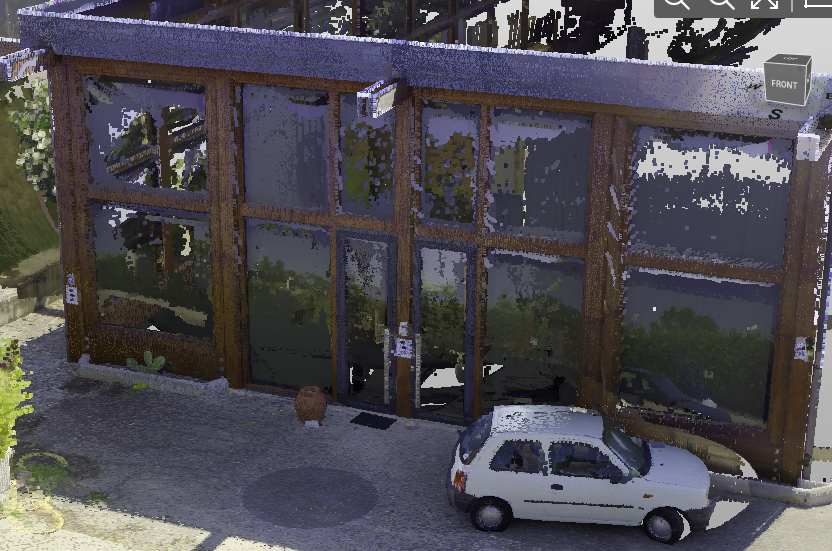
|
|
Extra large: point size is extra large. |
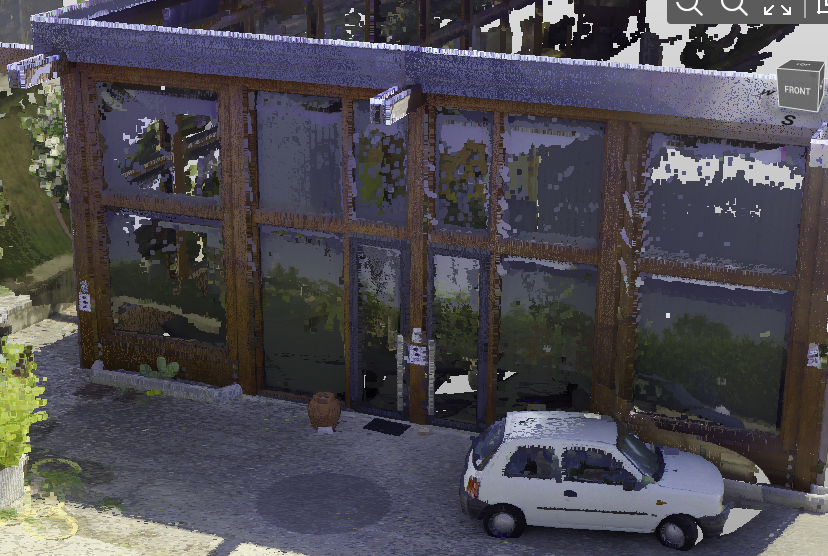
|
-
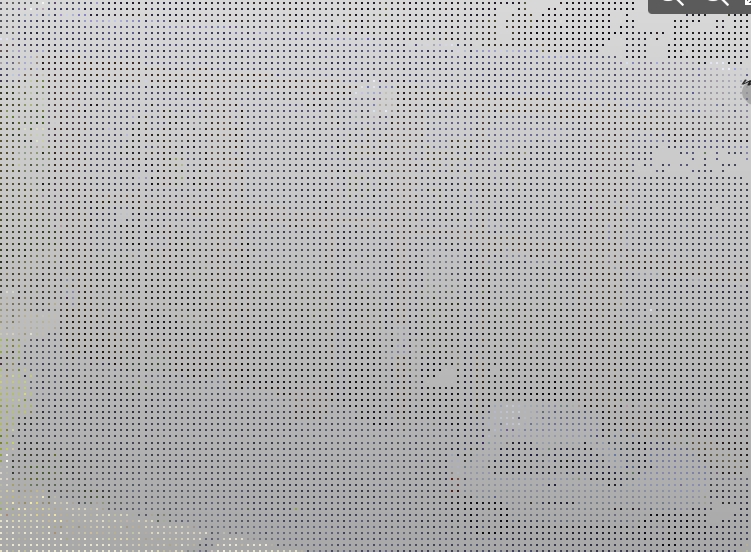
The points density allows to select the visualizations of points for each pixel.
|
Automatic: displays maximum number of points. (default selection) |
|
|
Level 1: screen density of one every pixel. |
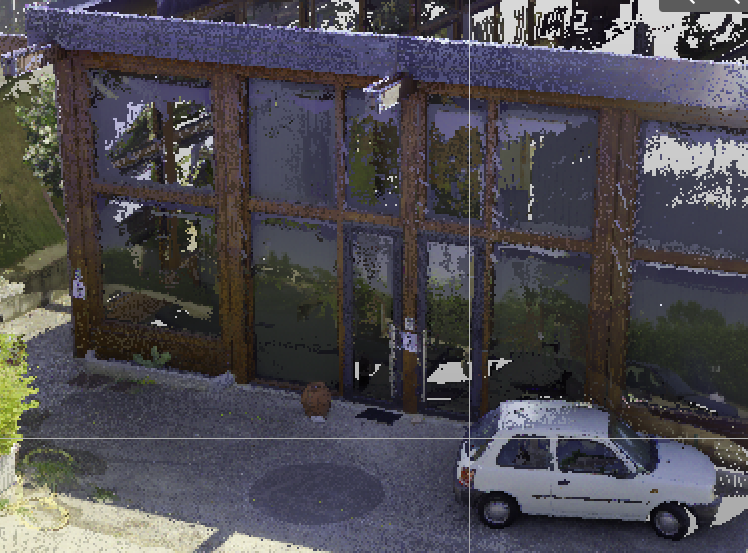
|
|
Level 2: screen density of one every two pixel. |
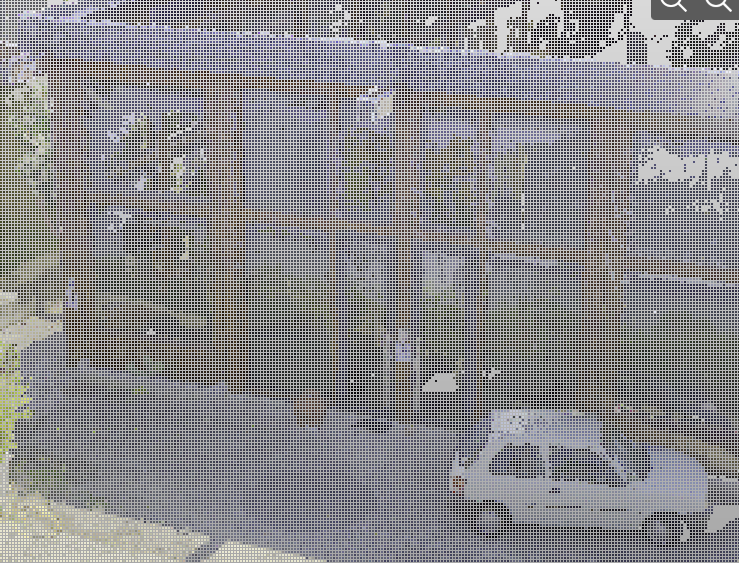
|
|
Level 3: screen density of one every three pixel. |
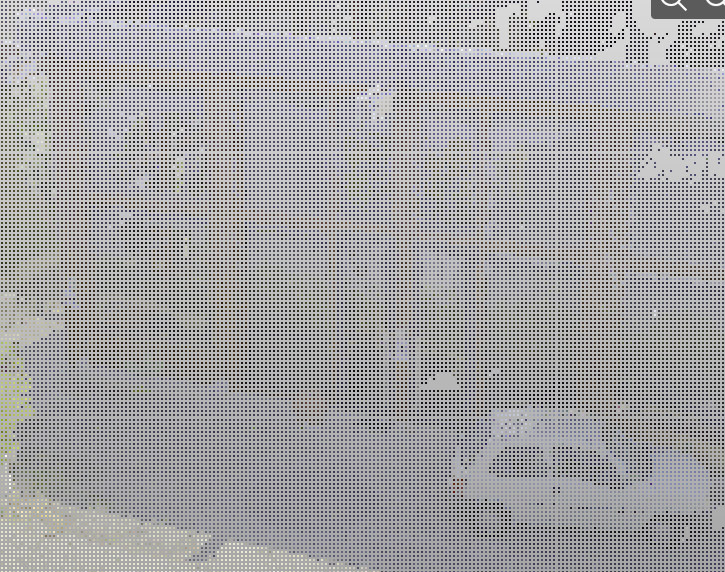
|
|
Level 4: screen density of one every four pixel. |
|
Rendering mode
This command allows to define the rendering mode to display the point cloud.
-
Click Cloud.
-
Click Rendering mode.

-
The drop-down menu allows to define the rendering mode.
|
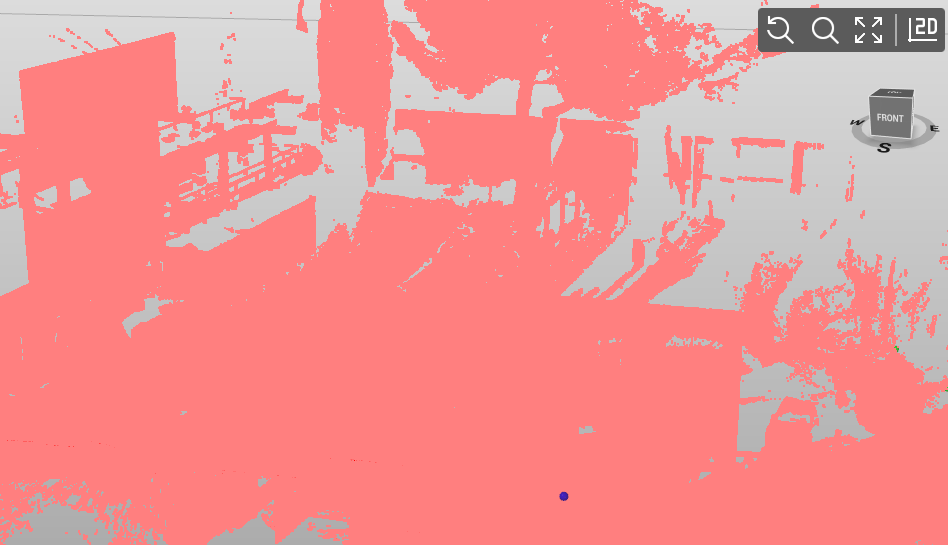
Color: applies to scans the main color set. |
|
|
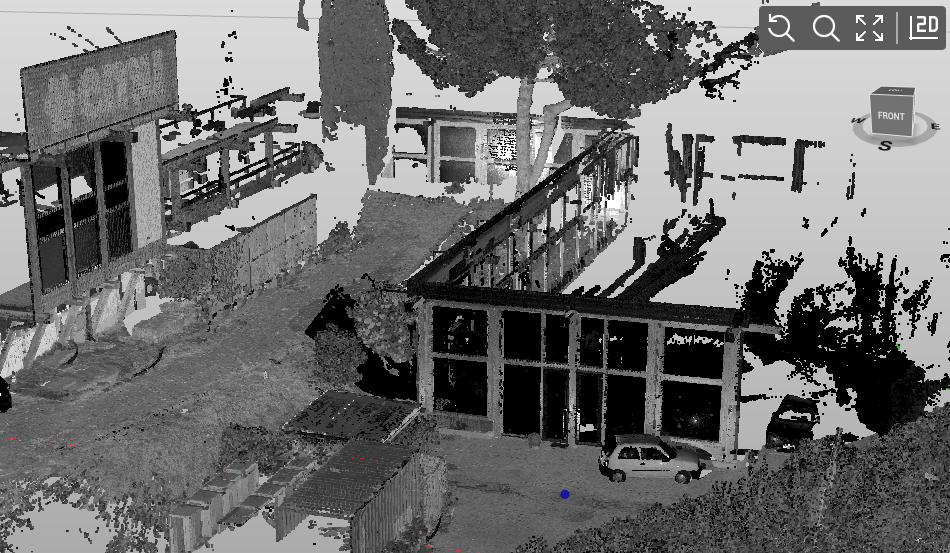
Intensity: colors all scans with a grayscale based on the intensity of the reflectance.
|
|
|
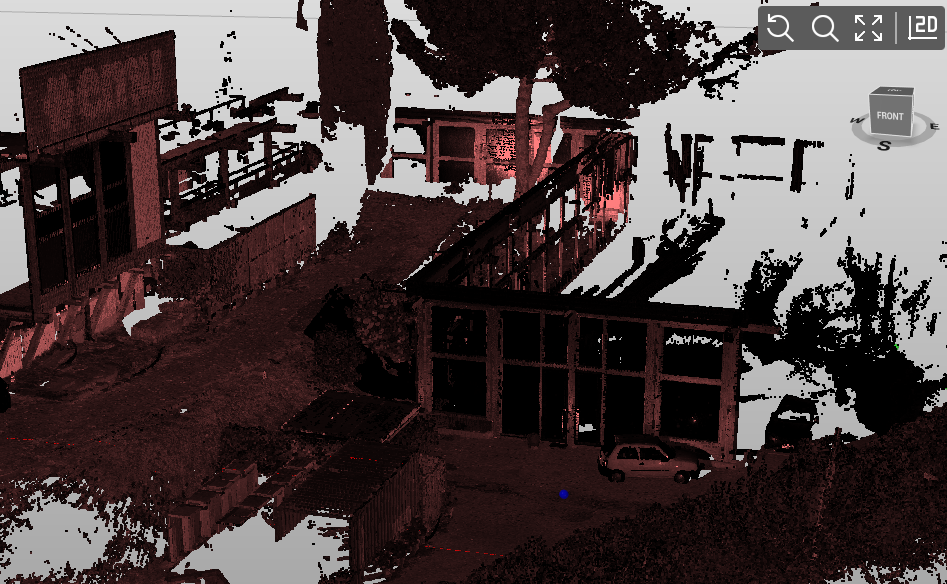
Intensity coloured: colors all scans with a color scale depending on the intensity of the reflectance. The color assigned to the point clouds by the program is used.
|
|
|
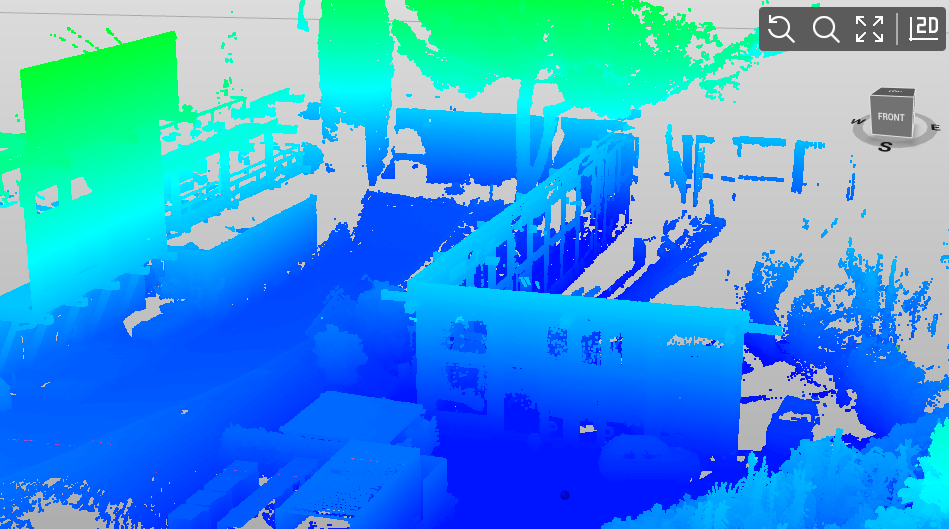
By elevation: colors all scans with a color gradation based on the elevation. A fixed color scale ranging from red (high) to blue (low) is used.
|
|
|
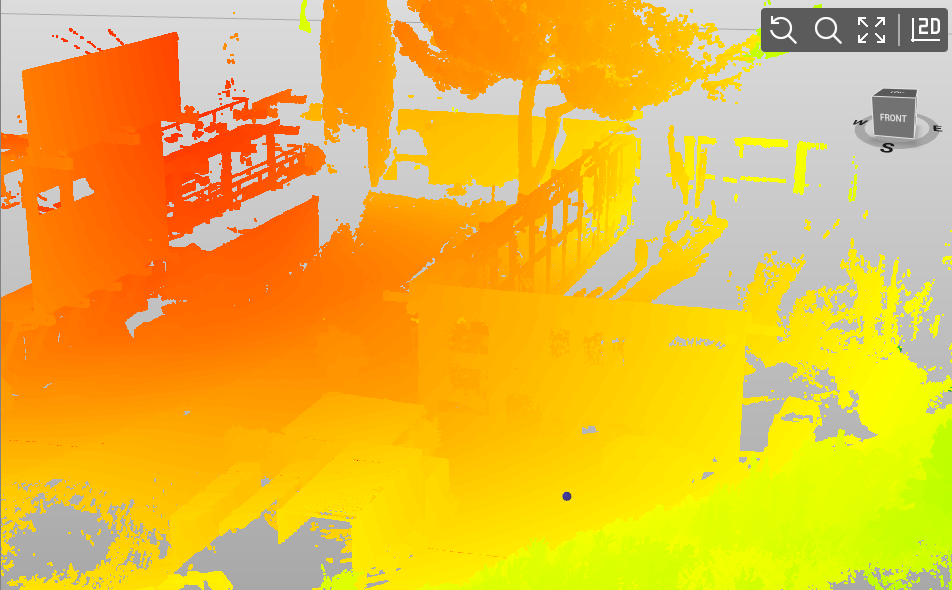
By distance: colors all scans with a color gradation based on the distance from point cloud center. A fixed color
|
|
View/hide point clouds components
It is possible to enable/disable the visualization of different points clouds components.
-
Points

-
Setups

-
Pano images

-
Center marker

-
Bounding box