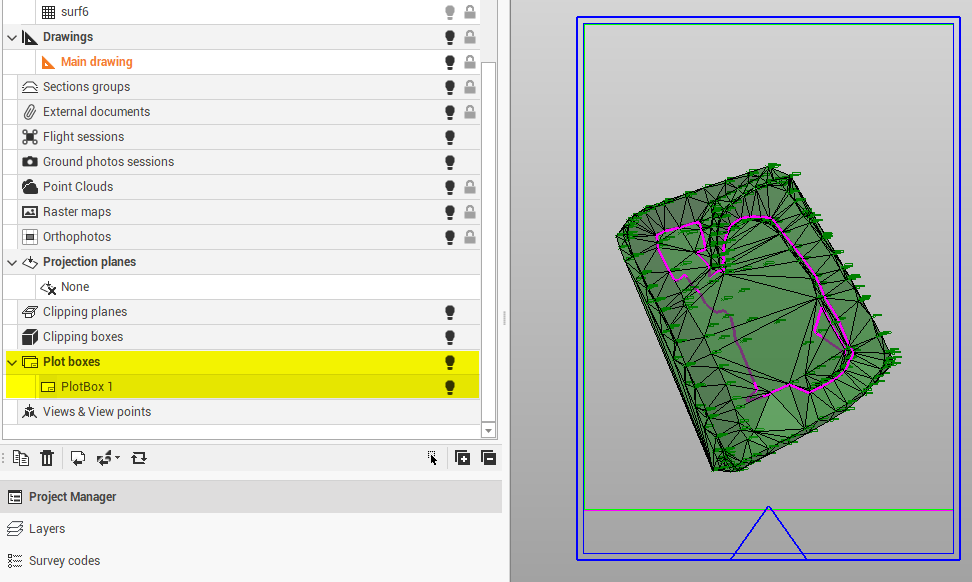
Create plot boxes for plotting a specific area of the graphical view. This is the first step for printing the drawing.
The plot boxes are saved and displayed in Project manager in the category Plot boxes.
-
Click Output.
-
Click Add plot box.

-
This command opens a new panel on the right:
-
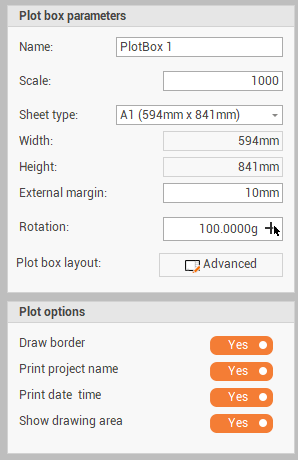
Name: sets the name of the plot box.
-
Scale: set the graphic scale according to which the size of the plot box is calculated.
-
Sheet type: sets the size of the print.
-
Width: sets the width of the print area if the sheet type is customized or shows the set width.
-
External margin: sets the size of the outer margin of the plot box.
-
Rotation: enter the rotation value.
-
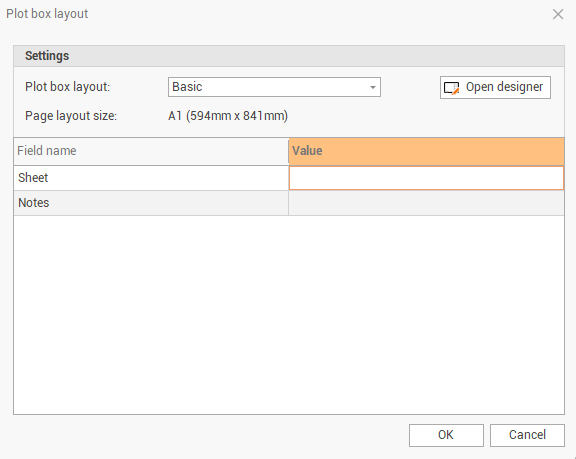
Plot box layout: to select one of the available plot box layout and enter the value of the fields. See Layout designer on how to edit plot boxes layouts.
-
Click on the selected plot box layout to open a window where to enter the value for the title block fields.
-
-
Draw border: enables/disables the drawing of the plot box borders.
-
Print project name: enables/disables the printing of the project name.
-
Print date time: enables/disables the printing of date and time.
-
Show drawing area: enables/disables the visualization on CAD of the plot box drawing area, according to the selected plot box layout.
-
-
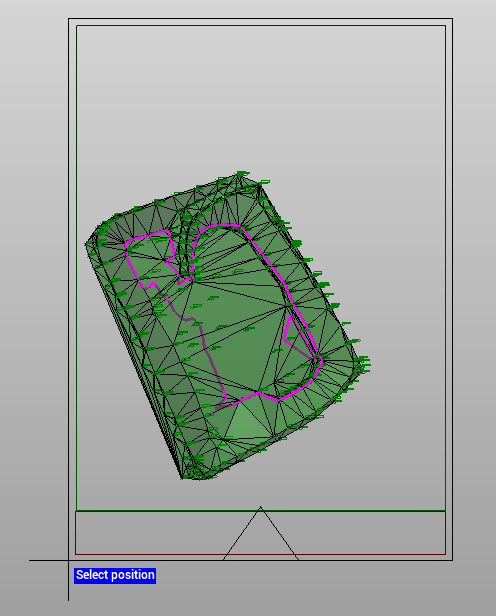
In the graphic view click to select the plot box position.
-
The plot box is created in the graphic view and in the Project Manager.