GNSS Survey interface
 |
|  |
| 
The graphic interface when using a Survey function with a GNSS receiver is explained in this chapter.
To record points with a GNSS receiver, open Survey page.
Select Survey points.
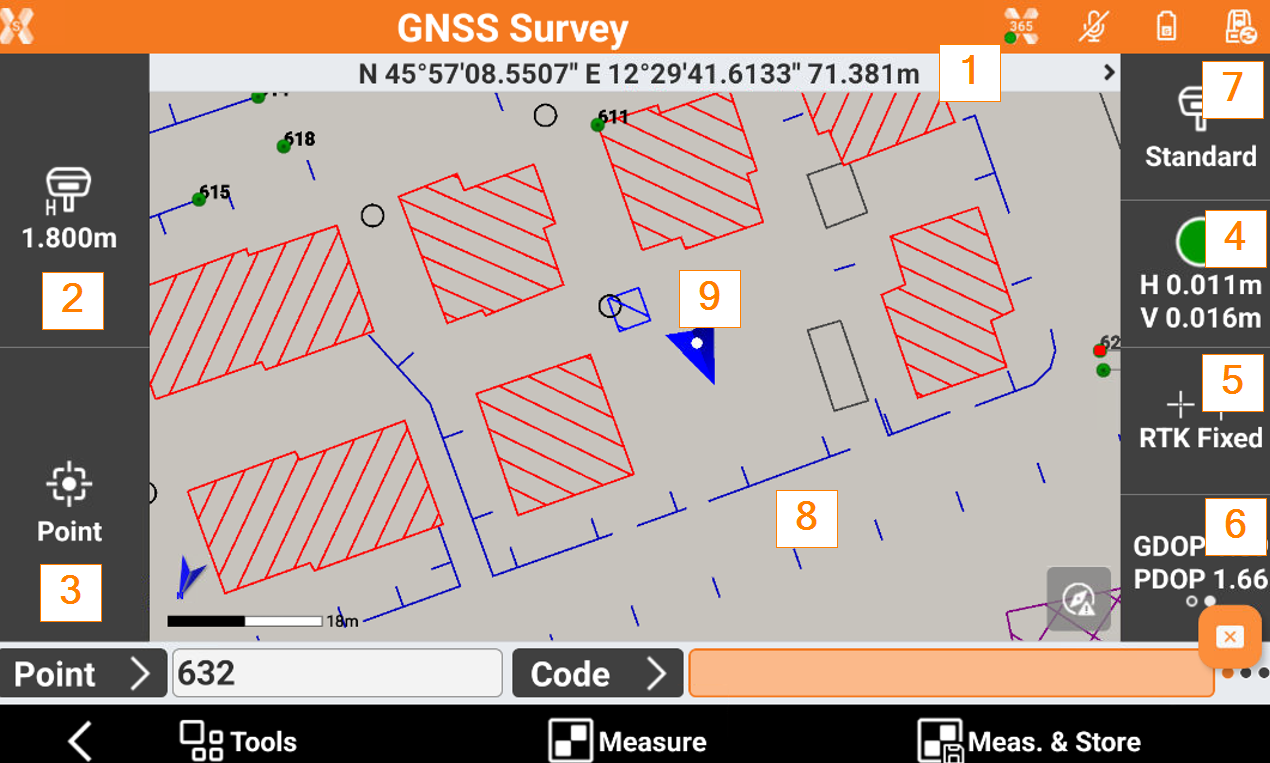
Coordinates: the geographic coordinates (latitude, longitude, elevation) of the receiver. Click to change the visualization to plane coordinate and to distance and slope from the previous visualization mode.
Antenna elevation: elevation of the antenna of the receiver. Click to modify the elevation.
Smart drawing: displays the current status of the function Smart Drawing. Click to select a tool for drawing or the operation to perform.
Accuracy: the color of the icons indicates if the precision level set in the GNSS Settings has been reached. The epochs are acquired only when the level of precision has been reached (horizontal and vertical precision, minimum number of satellites, maximum values of DOP, electronic bubble). Below the icon, the current precision values for coordinates (H) and for elevations (V) is displayed.
Receiver status: opens the GNSS Status page to show the status information of the GNSS receiver.
Satellite/DOP: shows the number of satellites tracked, for constellations GPS, GLONASS, BeiDou, SBAS. Click to display the DOP values.
GNSS Measure mode: opens the selection of the GNSS measure mode.
Graphic area: graphic view with visualization of survey and drawing. Refer to CAD view in survey and stakeout functions.
Current position: indicates the current position.
Blue: All parameters of operation satisfy the preset level of accuracy.
Red: The accuracy parameters are not met.