


-
The Point average function allows to perform an average of a set of points.
-
All residuals are displayed and is possible to have the full control on how the average is executed.
-
The result can be stored as a new topographic poin.
-
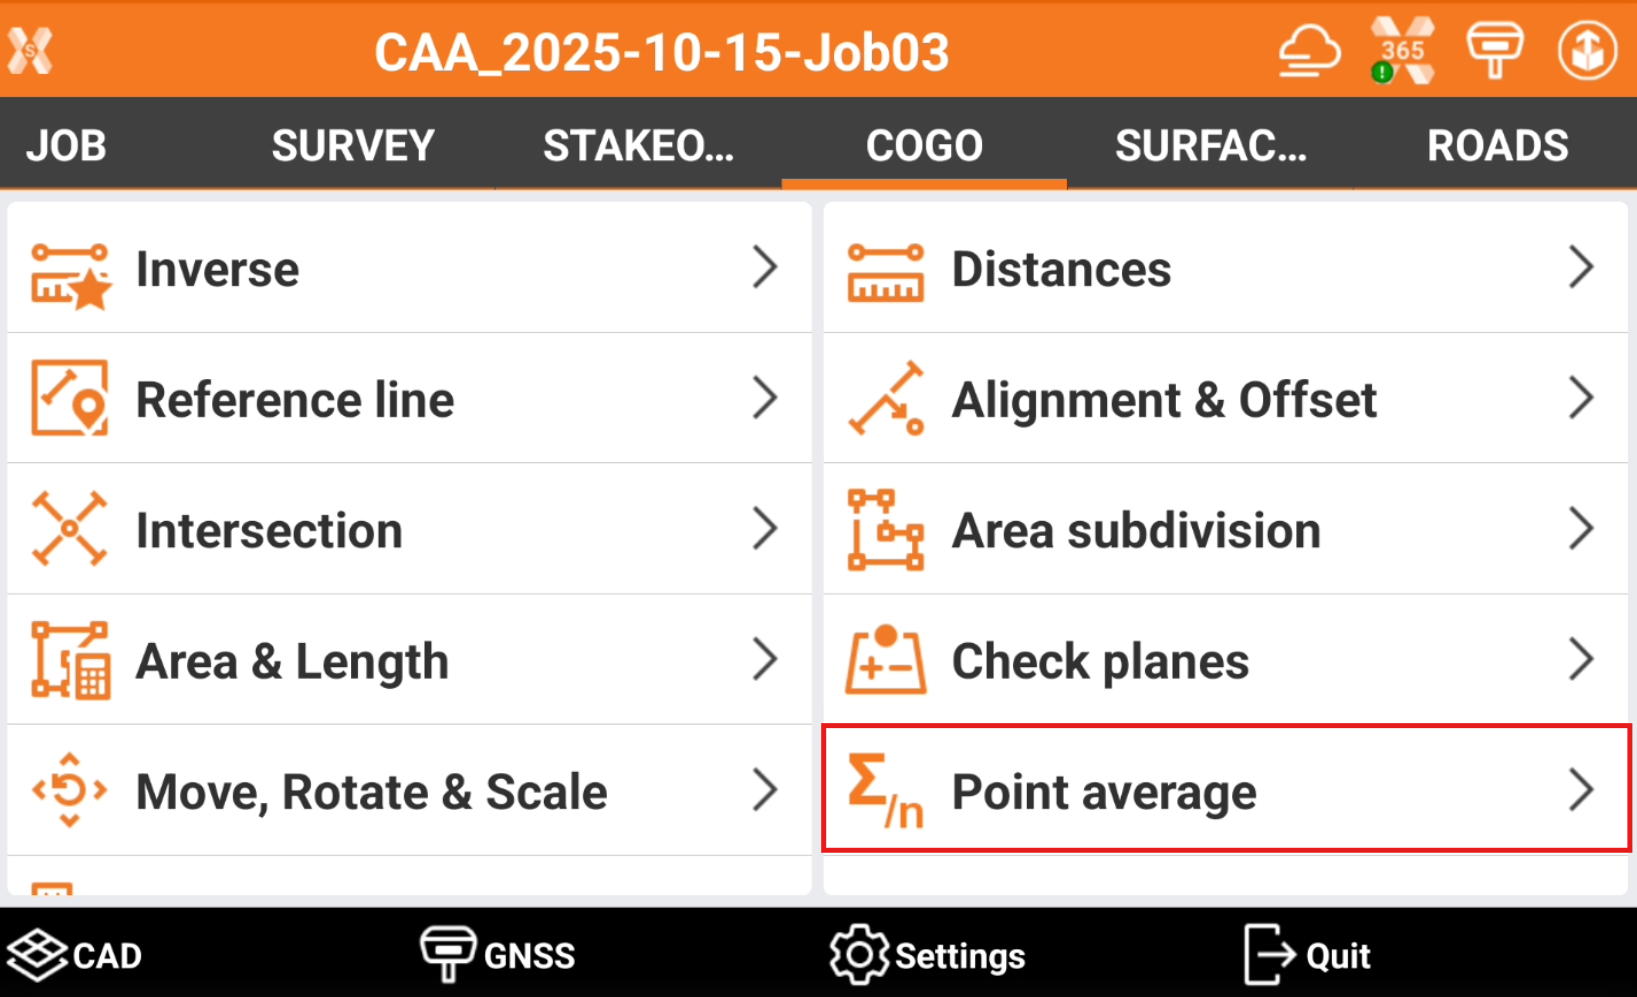
Click COGO.
-
Click Point average.
-
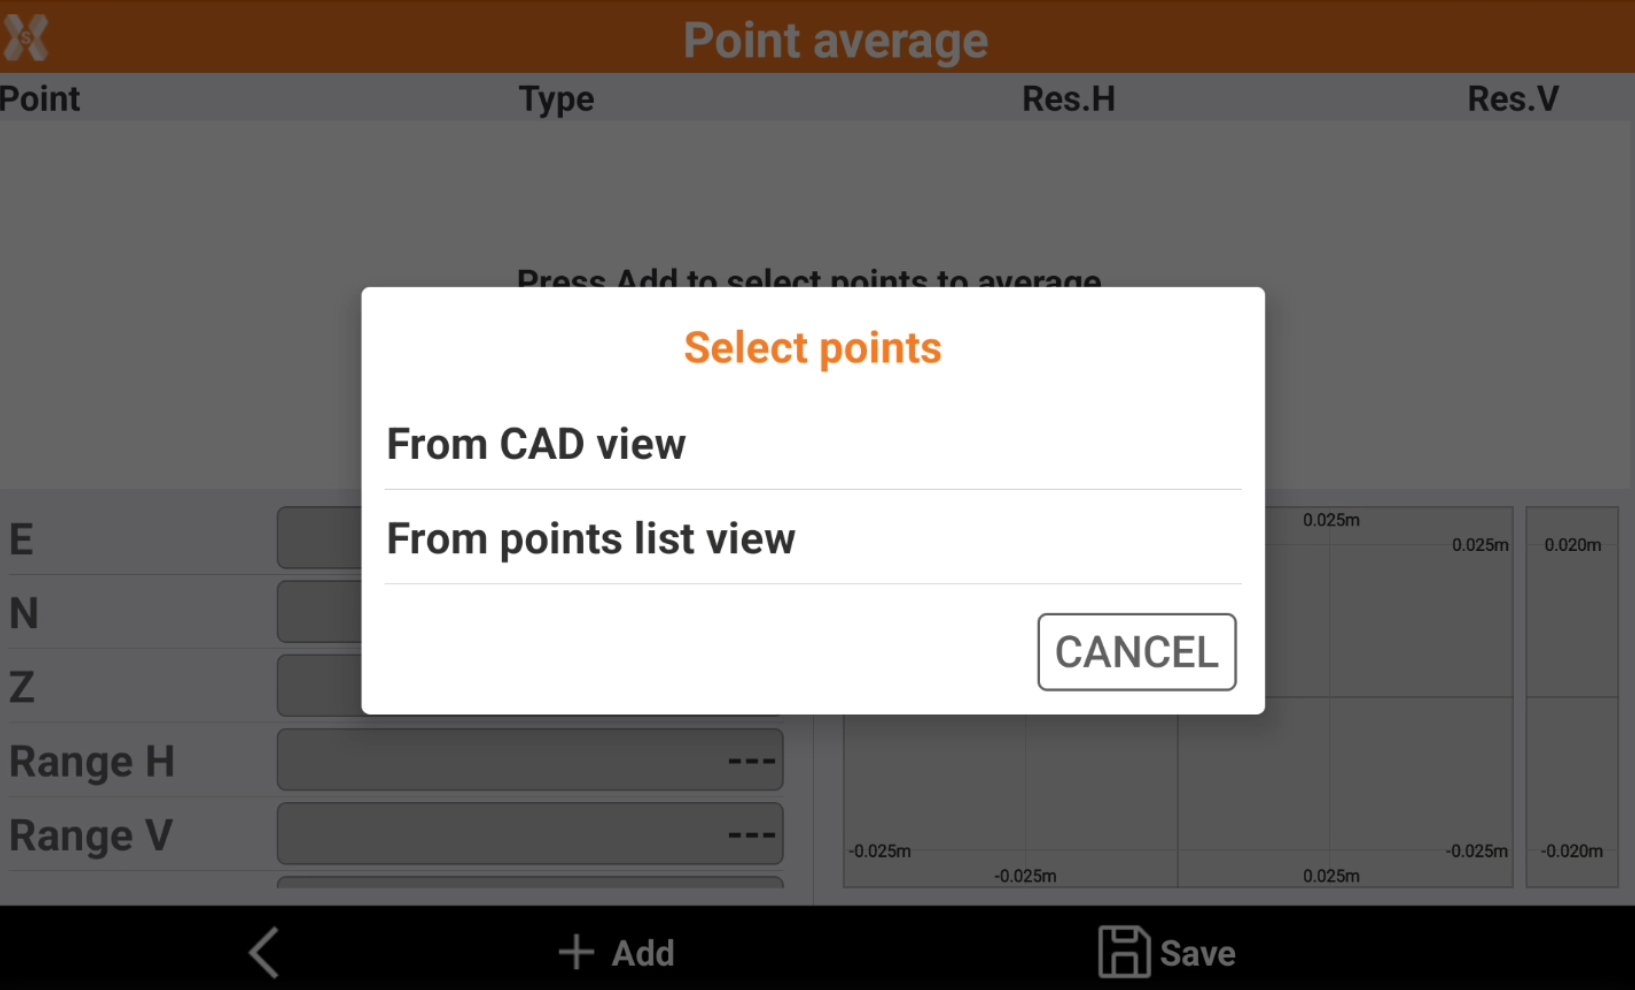
Select if the points have to be selected from CAD view or from the point list view.
-
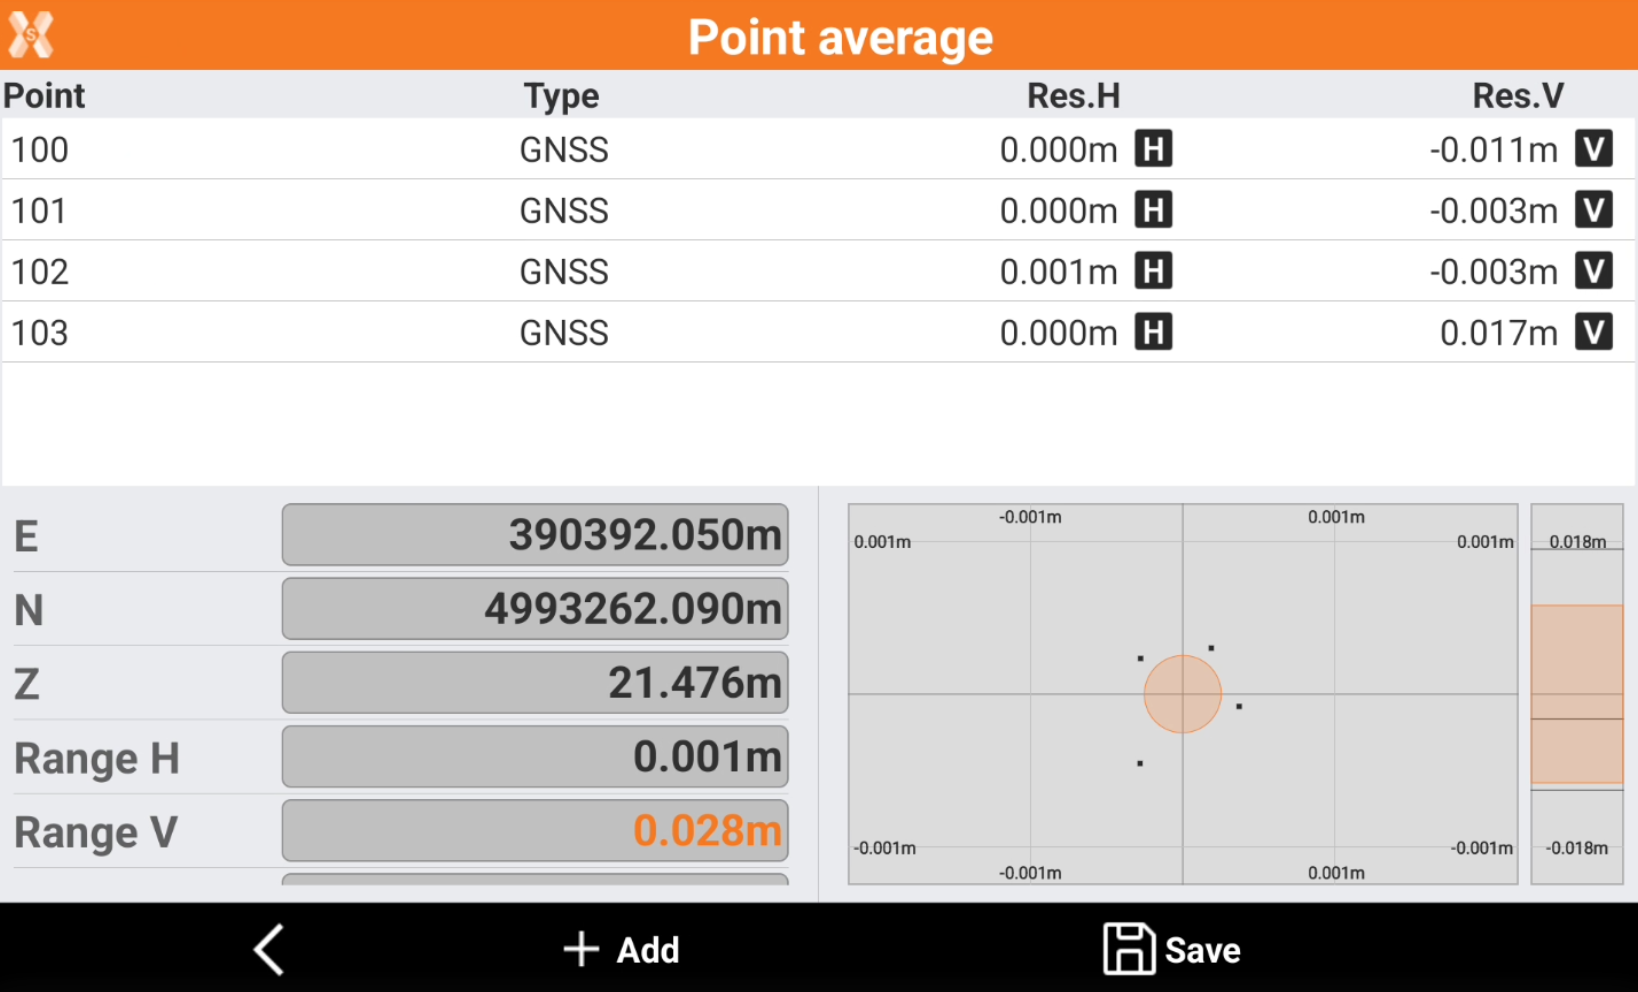
The software shows the residuals and the calculated coordinate.
-
Click H and V to disable/enable the use of a specific point’s 2D or elevation component.
-
E/N/Z: the averaged coordinate of the point.
-
Range H: the maximum 2D distance between the measured points.
-
Range V: the maximum elevation distance between the measured points.
-
Std.Dev.H: the horizontal standard deviation for the measured points.
-
Std.Dev.V: the vertical standard deviation for the measured point.
-
CI H 95%: horizontal 95% confidence level. The value represents a range within which 95% of the measured positions are expected to fall. A larger value indicates lower position quality, while a smaller value means that most points have similar positions.
-
CI V 95%: vertical 95% confidence level. The value represents a range within which 95% of the measured positions are expected to fall. A larger value indicates lower position quality, while a smaller value means that most points have similar elevation.
-
-
Click Add to add additional points.
-
Click Save to save the result as new topographic point.