



-
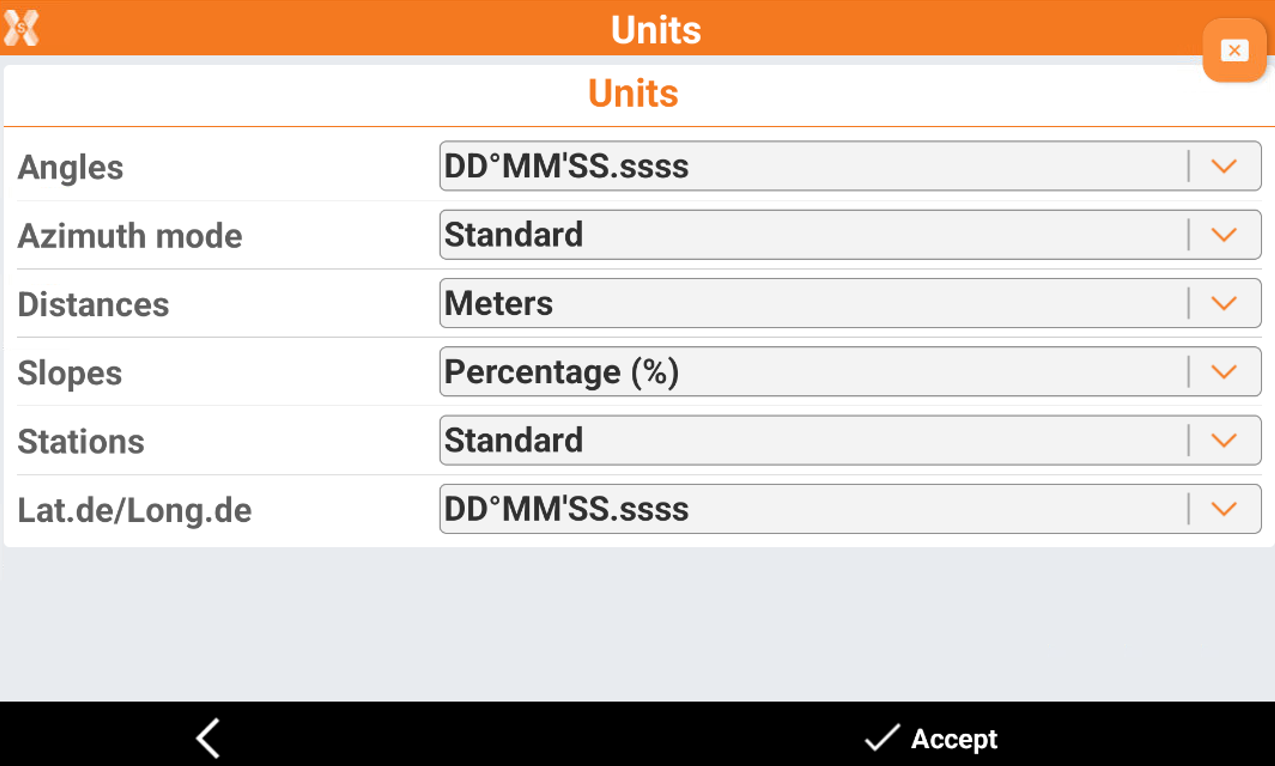
The page allows to set the units for measurements to use for every type of data.
-
Click Settings.
-
Click Units.
-
Angles: defines how the angle is visualized.
-
Centesimal (gon): the angles are visualized as centesimal angle in gon.
-
Decimal (0-360): the angles are visualized as sexagesimal angles in degrees.
-
DD°MM’SS.ssss: the angles are visualized as sexagesimal angles in degrees, minutes and seconds.
-
-
Azimuth mode: defines how the azimuth is visualized.
-
Standard: the azimuth is visualized as standard angle from reference meridian.
-
Bearing: the azimuth is visualized as bearing. A bearing is the clockwise or counterclockwise angle between north or south and a direction.
-
-
Distances: to select the unit for distances.
-
Meters: distances are visualized in meters.
-
Millimeters: distances are visualized in millimeters.
-
Feet (Intern.): distances are visualized in international foot.
-
Feet (US): distances are visualized in US survey foot.
-
Feet fract. (Intern.): distances are visualized in international fractional foot and inches.
-
Feet fract. (US): distances are visualized in US survey fractional foot and inches.
-
-
Slopes: defines how the slopes are visualized.
-
Percentage (%): slopes are visualized in percentage.
-
Angles: slopes are visualized with the slope angle.
-
Ratio (height:base): slopes are visualized as ratio between the height and the base.
-
Ratio (base:height): slopes are visualized as ratio between the base and the height.
-
-
Stations: defines the visualization of increasing stationing on an alignment.
-
Standard: the stationing is visualized with the standard distance unit selected.
-
X+YYY.ZZZ: the stationing is visualized as X+YYYY.ZZZ, for example 10123.478m means station is 10+123.478m.
-
20m+YY.ZZZ: the stationing is visualized as 20m+YY.ZZZ, for example 10123.478m means station is 10120+3.478m.
-
-
Lat.de/Long.de: defines the visualization of latitude and longitude.
-
DD°MM’SS.ssss: the latitude and longitude angles are visualized as sexagesimal angles in degrees, minutes and seconds.
-
Decimal (0-360): the latitude and longitude angles are visualized as sexagesimal angles in degrees.
-
-