

-
The function Advanced Average and Analysis allows to measure a point repeatedly re initializing the fix calculation at each measurement session.
-
It is possible to customize how the sessions are performed and the error tolerance.
-
At the end of the measurements the software shows the residuals and accuracy information.
-
It is possible to export the detail of all measurements done.
-
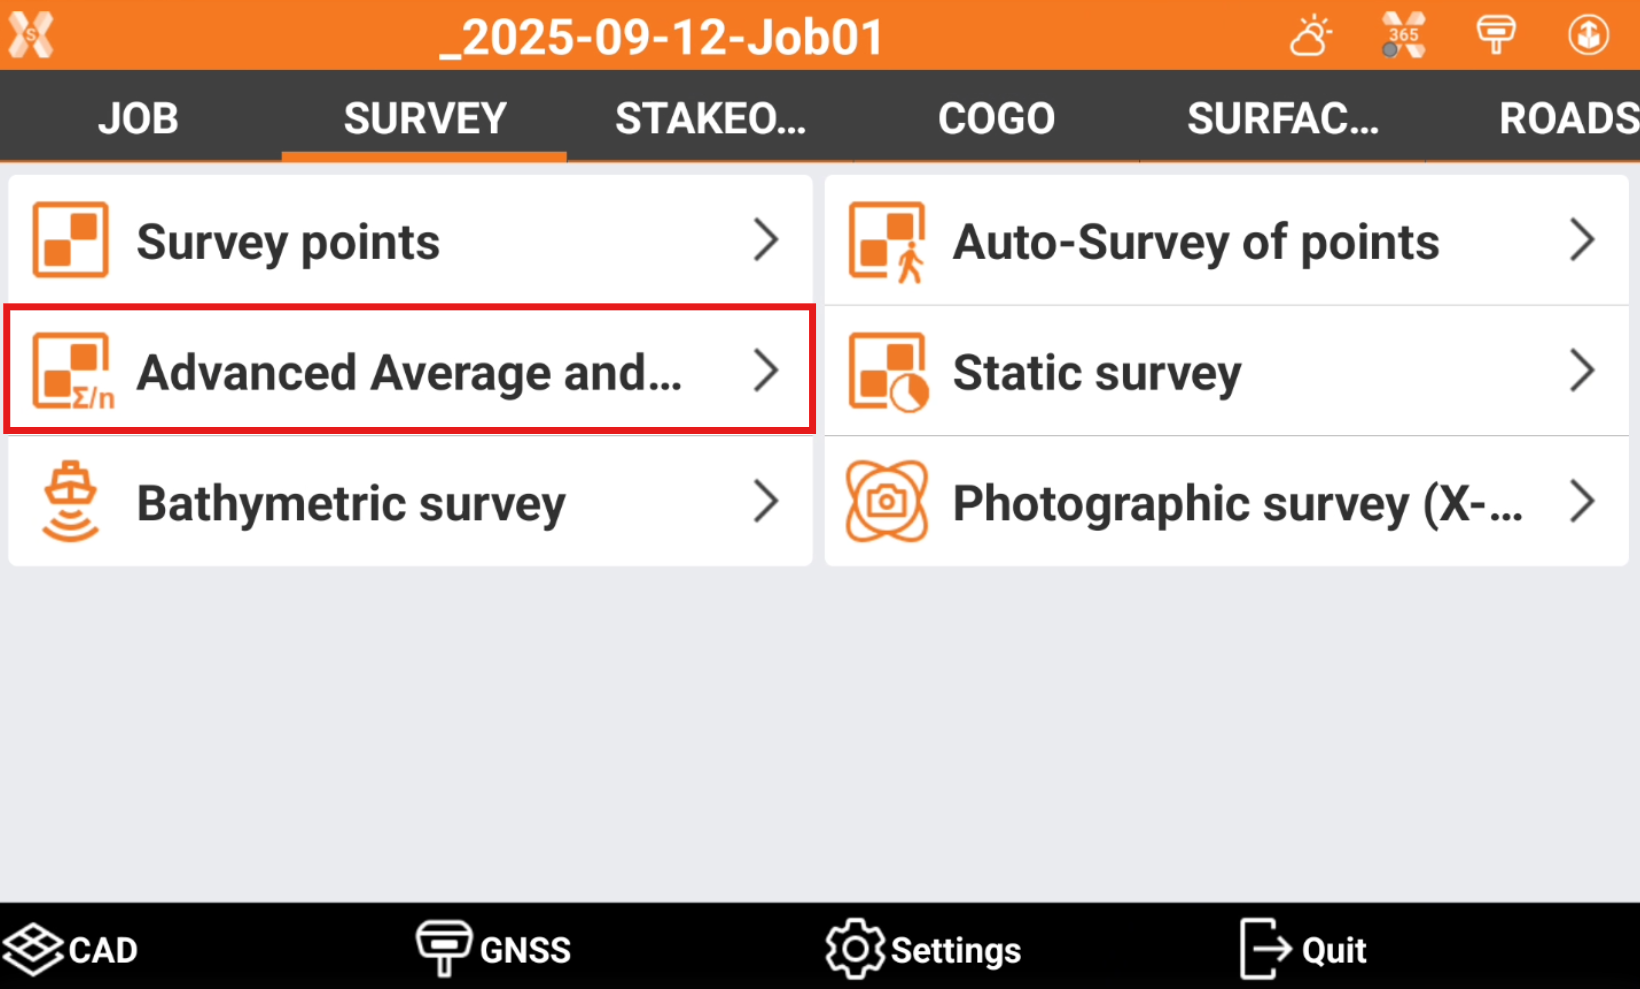
To start the application open Survey page.
-
Click Advanced Average and Analysis.
-
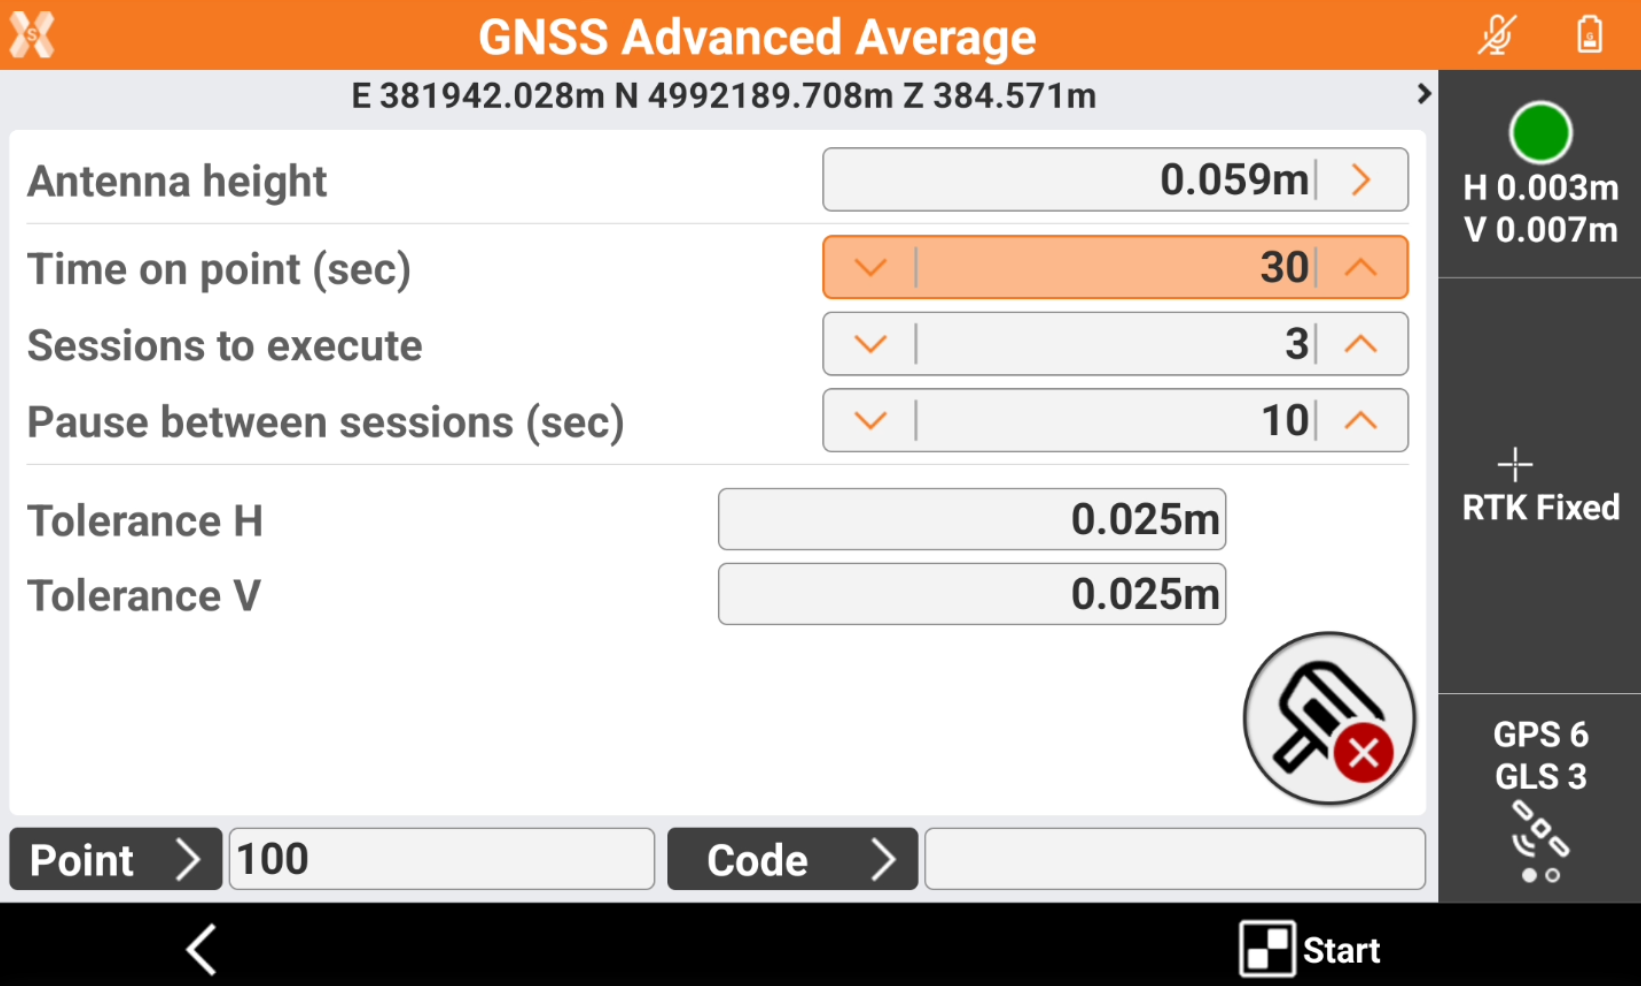
Enter the session parameters.
-
Antenna height: the height of the GNSS antenna.
-
Time on point (sec): defines the occupation time in seconds of each session.
-
Sessions to execute: defines how many sessions to execute. At the end of each session the receiver re inizialise the fix status.
-
Pause between sessions (sec): defines the pause time in seconds after a session is executed and while the receiver is in autonomous status without receiving RTK corrections.
-
Tolerance H: the value of the horizontal tolerance.
-
Tolerance V: the value of the vertical tolerance.
-
Point: the point name.
-
Code: the survey code.
-
-
Click Start to start the session.
-
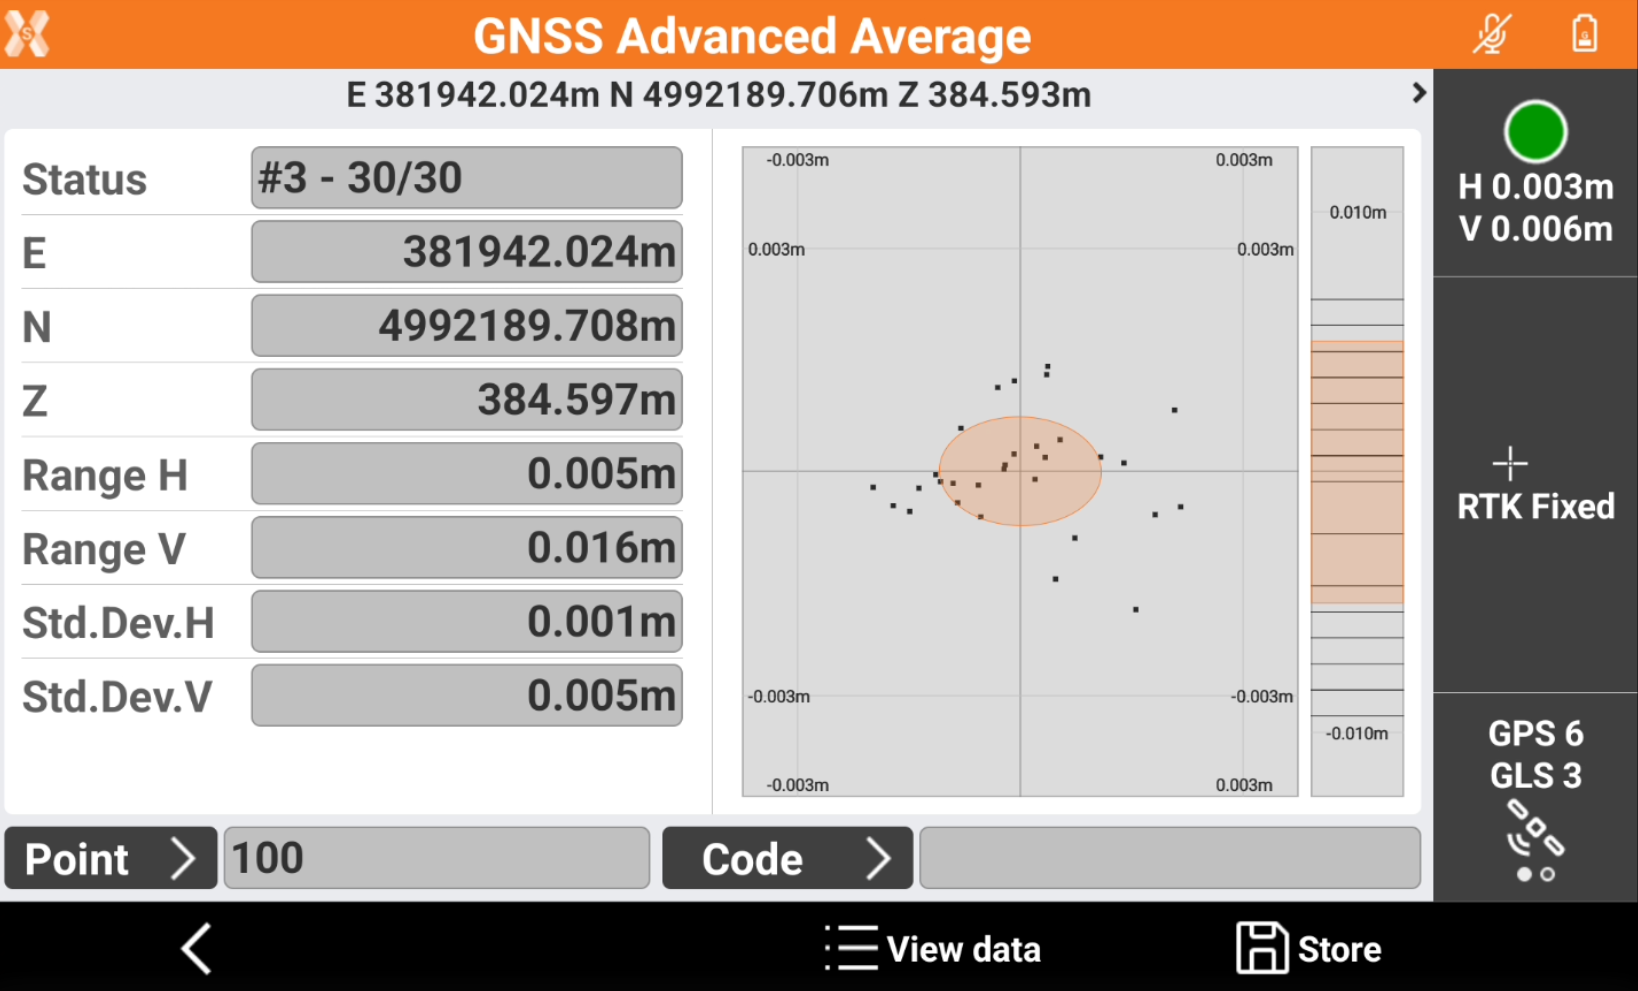
The point is measured by the time defined in Time on point (sec) and some information are visualized in real time.
-
Status: shows the number of measure in the current session.
-
E/N/Z: the measured coordinate.
-
Range H: the maximum 2D distance between the measured points in the current session.
-
Range V: the maximum elevation distance between the measured points in the current session.
-
Std.Dev.H: the horizontal standard deviation for the measured points in the current session.
-
Std.Dev.V: the vertical standard deviation for the measured points in the current session.
-
CI H 95%: horizontal 95% confidence level. The value represents a range within which 95% of the measured positions are expected to fall. A larger value indicates lower position quality, while a smaller value means that most points have similar positions.
-
CI V 95%: vertical 95% confidence level. The value represents a range within which 95% of the measured positions are expected to fall. A larger value indicates lower position quality, while a smaller value means that most points have similar elevation.
-
-
On the right panel the software visualizes the scatter plot of measured points in 2D and the points elevation in a vertical bar.
-
Click Pause to pause the measurements.
-
Click Stop to stop all measurements and close the function.
-
At the end of the last session it is possible to view the data and store the result.
-
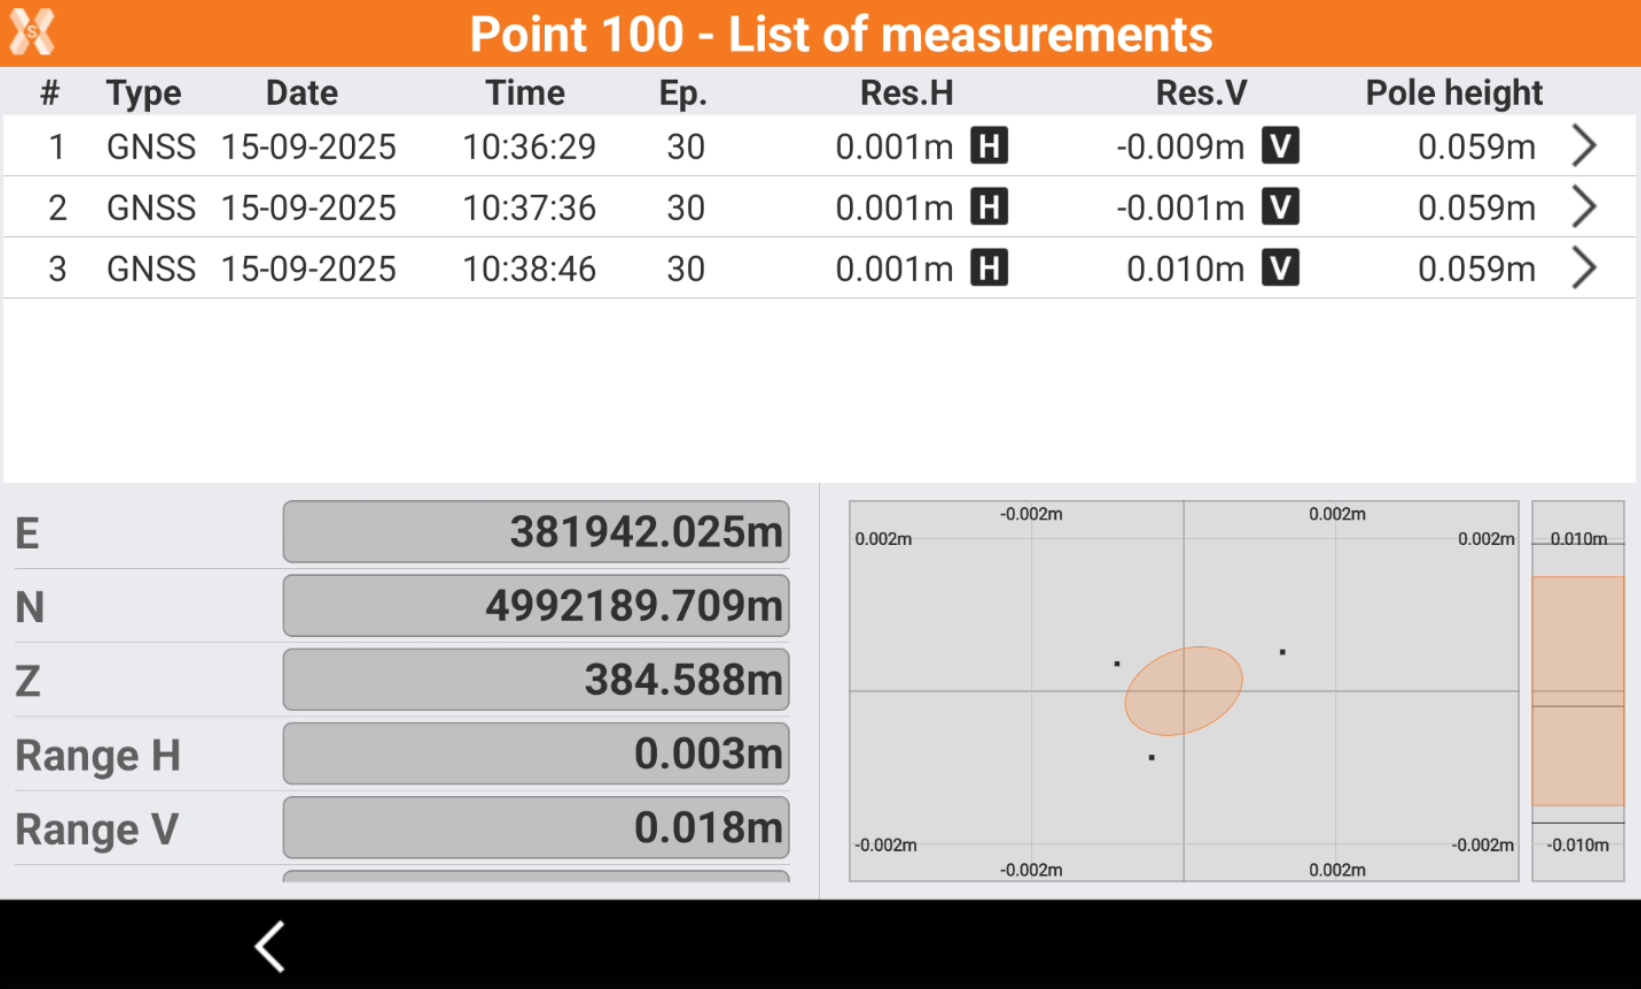
Click View data to visualize the result of the sessions.
-
The top part of the window shows the sessions performed. Click


-
The bottom part of the window lists the final coordinate and the quality result.
-
E/N/Z: the final coordinate of the point.
-
Range H: the maximum 2D distance between the measured points.
-
Range V: the maximum elevation distance between the measured points.
-
Std.Dev.H: the horizontal standard deviation for the measured points
-
Std.Dev.V: the vertical standard deviation for the measured points.
-
CI H 95%: horizontal 95% confidence level. The value represents a range within which 95% of the measured positions are expected to fall. A larger value indicates lower position quality, while a smaller value means that most points have similar positions.
-
CI V 95%: vertical 95% confidence level. The value represents a range within which 95% of the measured positions are expected to fall. A larger value indicates lower position quality, while a smaller value means that most points have similar elevation.
-
-
On the right-bottom part of the window the software visualizes the scatter plot of measured points in 2D and the points elevation in a vertical bar.
-
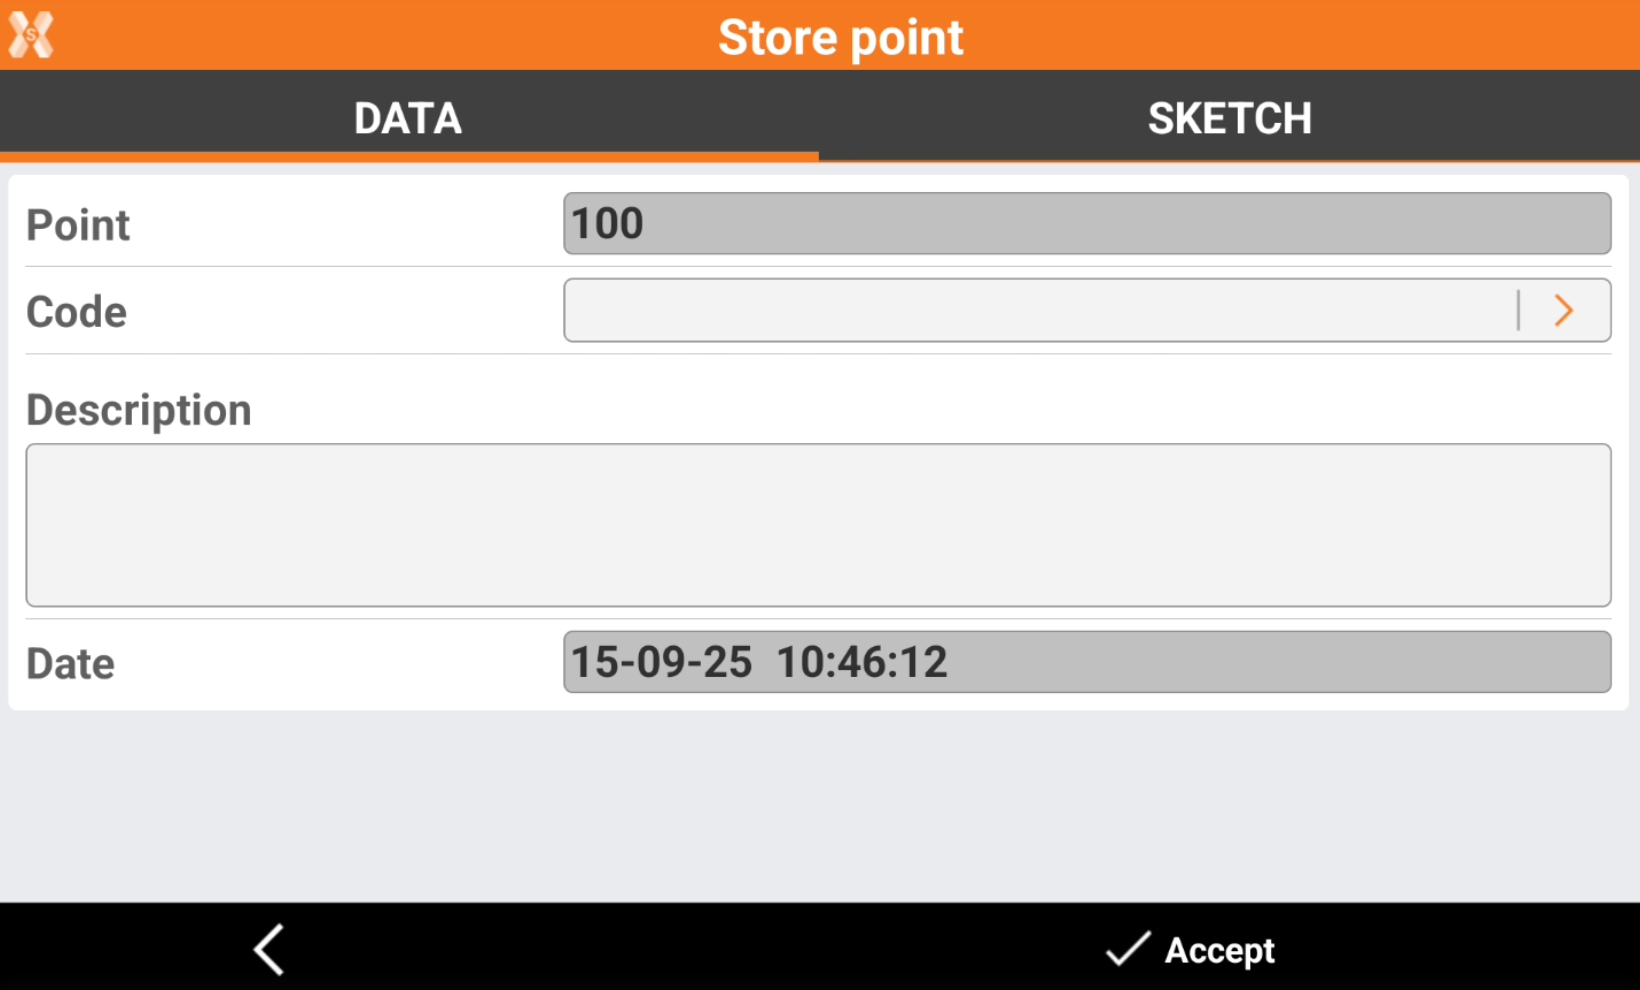
Click Store to record the measured point.
The single measurements performed can be exported as ASCII file.